Memory error detection technologies such as valgrind and address sanitizer are a critical part of the toolkit for programmers doing manual memory management. These tools allow you to detect memory access errors, memory management bugs, race conditions and more, in your programs. They are heavily used in companies developing high quality software such as Google, Facebook, Mozilla and more. A general problem with all these tools is that there is no easy way to aggregate their errors and action on them. This post introduces our team’s workflow for ensuring memory errors are never missed, signal-to-noise ratio is high and our software remains stable. To support this, we built some functionality into the Backtrace system that allows folks like you to also build similar workflows and ensure these important errors are under control.
Introducing memory error aggregation
This section introduces memory error aggregation with Backtrace. If you’re interested in learning about our particular pipeline, then jump to the next section. If you are interested in learning more about memory error tooling and sanitizers, check the resources section. The official product announcement post related to this thread is found here.
Address sanitizer, thread sanitizer, memory sanitizer, valgrind and Dr. Memory are currently supported for aggregation.
To get started with, create a Backtrace account and follow the steps after creating your first project. There are integration guides that will give you invocations you can use for every supported memory error tool.
For example, below I compile and then generate stand-alone logs for address sanitizer in a toy program.
$ gcc -o asan asan.c -ggdb -O0 -fsanitize=address -fsanitize-recover=address
Then, I run the program, ensuring that ASAN outputs errors to a dedicated log file.
$ ASAN_OPTIONS='halt_on_error=0:log_path=asan.log' ./asan
1
$ head -2 asan.log.28706
=================================================================
==28706==ERROR: AddressSanitizer: heap-use-after-free on address 0x602000000350 at pc 0x556b4fb1b0ad bp 0x7ffd905db120 sp 0x7ffd905db110
Finally, I use curl to upload the error to our Backtrace instance.
$ curl -s --data-binary @asan.log.28706 'https://morgue.backtrace.io/yolo/581ea67153e3399725dabe70eb6085efd7daeef3539ac72b4ab1a66ea626371f/sanitizers?application=asan&version=1.0.0' | json_pp
{
   "created" : 20,
   "kind" : {
      "AddressSanitizer" : 2,
      "heap-use-after-free" : 1,
      "LeakSanitizer" : 18,
      "DirectLeak" : 18,
      "bad-free" : 1
   },
   "status" : "ok",
   "count" : 20,
   "guid" : "be109306-c80c-326c-85cf-8b15016602ad",
   "failures" : 0,
}
Additional query string parameters are passed for application and version
to search on this data. In addition to this, a guid is returned that I can
use to search for memory errors from this single log. Below, I see the
aggregated data. This one report generated 5 unique memory errors: a few memory
leaks, a use-after-free and a bad free.
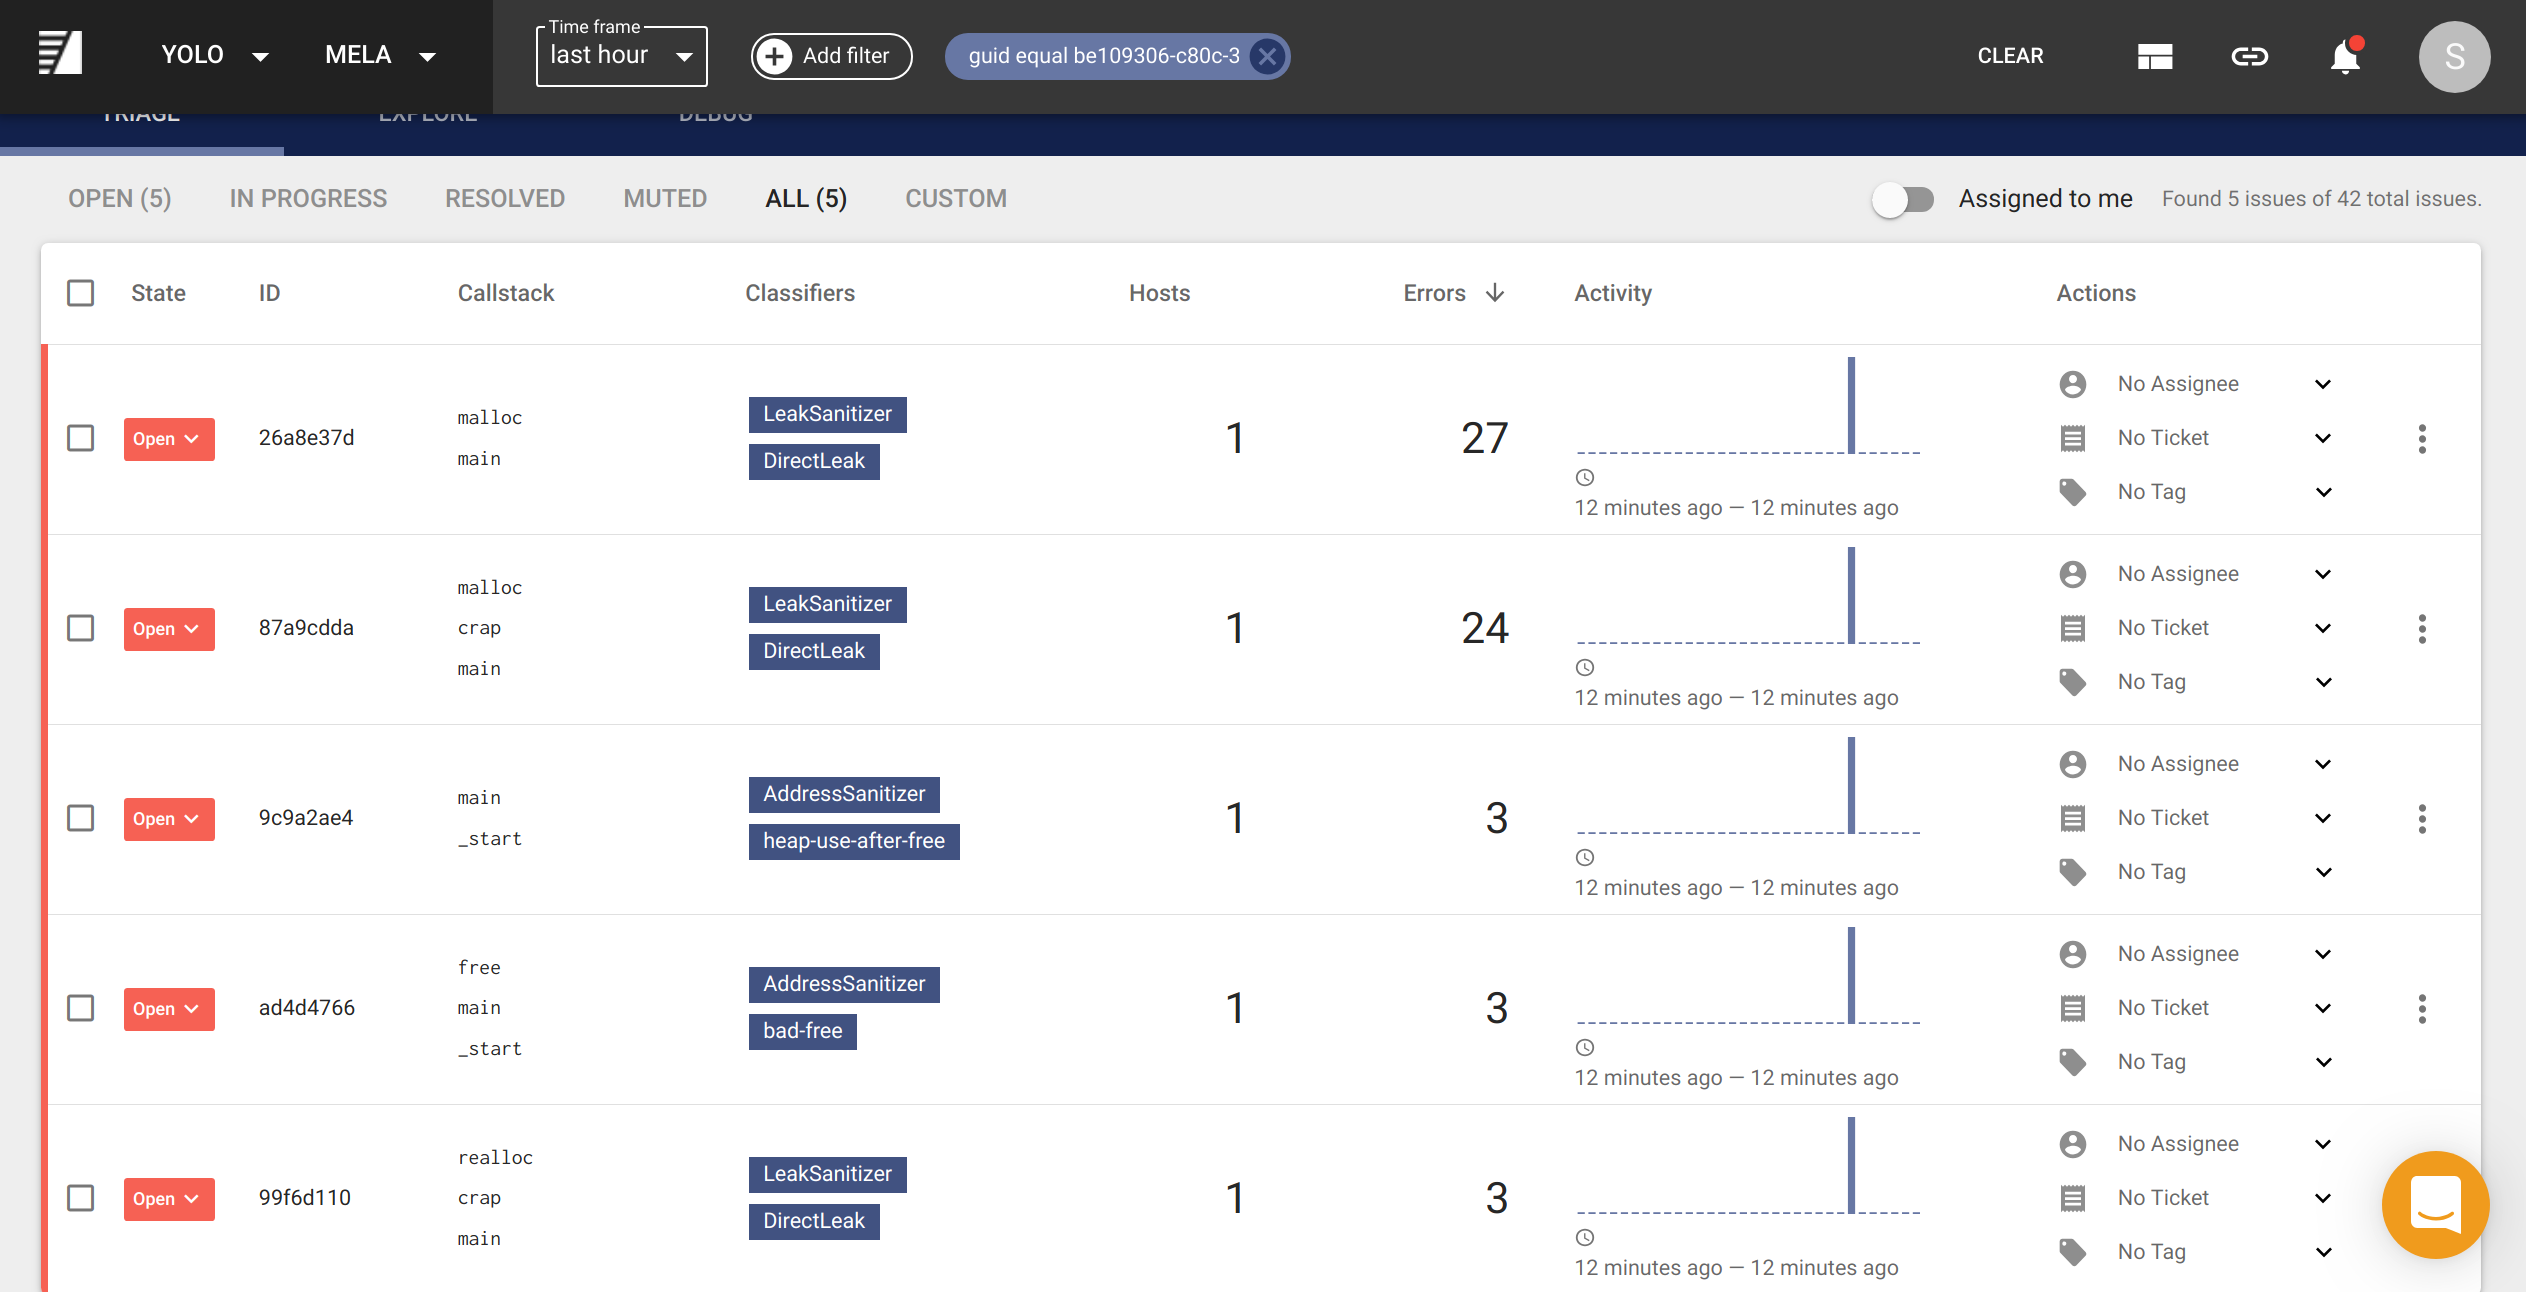
From here, I am able to:
- Determine how much are different memory leaks contributing to memory waste and which are the most important.
- Answer which commit or version was a particular memory leak introduced in my application.
- Determine how common a memory leak or memory error is across my workload and memory error reports.
- Identify newly introduced memory errors and optionally take automated actions such as creating a ticket for our engineering team to resolve.
- Identify high-level trends with a flame graph visualization of memory errors.
Examples of these workflows are in the Example Workflows section.
Supported Aggregation Sources
Currently, the following sanitizers are supported:
- valgrind: memory error checking and more for UNIX and UNIX-like systems.
- sanitizers: a suite of fast memory sanitizers available to gcc, clang and more, with Windows support.
- Address Sanitizer
- Leak Sanitizer
- Memory Sanitizer
- Thread Sanitizer
- drmemory: memory error checking and fuzzing.
If you are using another error checker, and are interested in seeing support for it, please contact us at support@backtrace.io.
Managing Memory Errors at Backtrace
This section discusses how we aggregate memory errors across our environments, and the data model that worked for us in order to incorporate memory error checkers into a repeatable process.
A dedicated project was created to store these memory errors, and integrations were built into our work-tracking and alerting systems.
Memory errors logs are aggregated from the following sources:
- Our developers are required to run tests locally under a sanitizer, usually
either
valgrindorasan. Optionally, they can enable aggregation in order to better understand their report results. - Integration tests are triggered under every build. All these tests are run under address sanitizer. The results are aggregated and reported on.
- Some of our hosts are running
asanbuilds around the clock on internal and production traffic. These hosts will continuously stream memory errors to our Backtrace instance.
Development Environment
Developers are free to enable automated reporting of memory errors on their development machines. This can be useful to triage newly introduced issues. These reports are filtered out from other report workflows and the developer is notified directly of any failures.
Integration Tests
Integrations are enabled for Slack, our collaboration application and for Phabricator, our issue tracker.
Builds will fail and alerts are triggered for every new and unique memory
error, excluding one-time memory leaks. Memory leaks on any request path will
trigger an alert. This is managed directly in the Backtrace user interface and
workflow integrations by muting and filtering unique issues. If an error is
marked as muted, it will not trigger an alert.
Routing rules are set up to assign any new errors to the user whose commit
triggered a build. Notification will also be sure to @mention the user on
Slack to grab their attention, with relevant information such as the callstack
of the memory error, impacted versions and more.
In addition to this, every report is assigned a queryable attribute so that the full results of any single integration test can be queried. It is possible to query across reports as well in order to understand when an issue was introduced and if it is correlated to other changes in the code-base. Finally, every integration test is encoded as an attribute so that the error history of a single test can also be viewed.
Test Environment and Production Baking
All memory errors in this environment will lead to a notification in a Slack channel. The engineer that is on-call is responsible for triaging the memory error.
Integrations are enabled for Slack, our collaboration application and for Phabricator, our issue tracker.
Example Workflows
In general, integrating memory error data into Backtrace made the data significantly more actionable. Suppressions are no longer needed as muting of false positives right in the user interface is easy and persisted. It was also possible for us to triage issues not only based on their classification, but also other data. For example, it was easy to identify bytes leaked across many different call sites to discern memory leaks that are having a substantial impact on our application.
Create Engineering Tickets
With just a few clicks, I am able to create a ticket into our issue tracker. The ticket is auto-populated with all the relevant information so that engineers can get started on root cause.
Filter on dimensions such as application name or memory error type
1153 errors across 64 reports were deduplicated to 5 unique memory errors. In this view, I drill down to memory errors impacting a specific application.
Visualize memory errors related to a particular subsystem
There were a few memory leak locations that were related, I am able to search for all of those memory errors and then view the differences in the callstack in one view.
Merge memory errors with the same root cause into one issue
It becomes easy to persist memory errors with the same root cause into the same underlying issue.
Exclude benign memory leaks in favor of real memory leaks
Using classifiers, over here I am able to filter down to memory errors that are not leaks.
Quickly identify amount of leaked bytes
In this view, I am able to identify how many bytes are actually being leaked by different call sites so I can narrow down on the biggest leak sites.
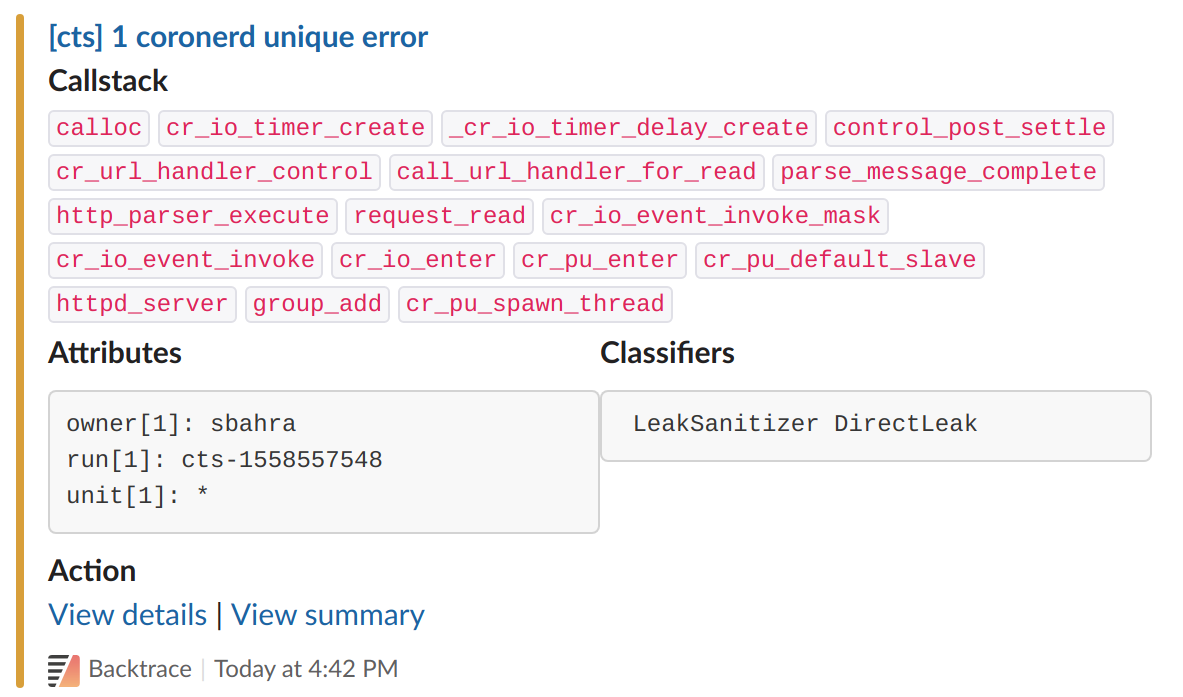
Alerting on New Memory Leaks
We configured our Slack integration to notify us of any newly introduced memory errors and leaks.
Conclusion
That’s it! With some simple data modeling and curl, you too can better
leverage these powerful memory error checking tools.
Please give it a spin, and let us know if you encounter any problems! Some of these tools do not have machine-readable output, and so a lot of reverse engineering was required to make the parsing reliable.
If you’re interested in seeing suppot for another tool, please let us know.
Direct messages on Twitter are also welcome @0xf390.
Resources
Below provide additional details on the various tooling that is out there.