Backtrace is an end-to-end debugging platform that software engineering and support teams use to improve software reliability by automating and enhancing the error management process. We are pleased to announce first-class support for Go with the latest release of our platform. With Backtrace, discover where goroutines were created and why they might be waiting; capture the contents and wait queues of channels; get deep insights into the runtime scheduler and, with an upcoming release, the garbage collector. Go beyond error reporting and take the guesswork out of debugging.
Our Solution: TL;DR
Backtrace streamlines the capture, analysis, and aggregation of your errors across environments in unprecedented detail. With just a few lines of Go code (shown near the end of this post), our tools will generate snapshots of your Go applications on demand and aggregate them into your Backtrace platform installation.
Think of snapshots as minidumps on steroids. They include:
- The state of all goroutines and threads, from variable information to stack size, wait duration, and scheduler interaction.
- Full introspection into complex types, like maps and channels, with pretty-printers.
- Runtime scheduler statistics along with global and per-process run queues.
The Backtrace platform takes these snapshots and intelligently groups errors according to potential root cause. You’ll be able to issue custom queries to explore interesting patterns across your errors and pull down specific snapshots to dig deeper into your application’s state at the time of error.
Overview
The debugging ecosystem for Go is still in its early stages. Though an
extension script is provided for it, gdb still
has many issues with Go’s concurrency model, data structures, and even its
emitted debug information. delve, a
gdb-like debugger built specifically for Go, is an excellent alternative in the
interactive debugging realm, but even it is limited in the level of
introspection provided – for example, understanding goroutine interdependencies
requires deeper visibility into channels and scheduler interaction. It’s also
difficult to use delve to efficiently capture and analyze errors across
multiple remote servers.
Whereas many existing commercial error reporting solutions for Go provide mainly just the standard tracebacks generated by the Go runtime, Backtrace utilizes purpose-built high performance debugging technology for deep introspection into application state. This includes full callstacks for all goroutines, including variable information.
This information alone, automatically extracted and stored, is useful when resolving a production outage. Go’s emitted debug information allows us to go even further, though.
State Introspection
Information critical to determining the root cause of an error is often found in complex data structures, like maps or interfaces. The way a programmer conceptualizes these structures can substantively differ from their underlying implementations. Because compilers and linkers emit debug information describing these implementations – essentially varied compositions (structs) of base types, like integers – rather than their abstract concepts, debuggers will by default show the ugly internals.
Ever print a C hash table in gdb? You probably had to implement a macro handling the specific implementation you’re using, iterating over arrays, chasing pointers, and checking various state.
It’s inefficient. You shouldn’t have to worry about data structure implementations to get the information you need. How many fields do you have to dereference before getting to an interface’s runtime type? Which ones? You’d have to look at Go’s runtime implementation of interface types – and several of its component types – to answer that. And then you’ll have to remember that answer for subsequent debugging sessions.
We reduce this cognitive load. Our tools will display all complex data structures (maps, channels, interfaces, etc.) in their natural forms. Their actual internals will be displayed alongside for deeper debugging.
The core of the pretty-printed output is as follows:
- Strings: the string and its length.
- Slices: the length, capacity, and underlying array.
- Maps: the total count and the elements themselves (by traversing all normal and overflow buckets).
- Interfaces: the runtime type and value of the interface.
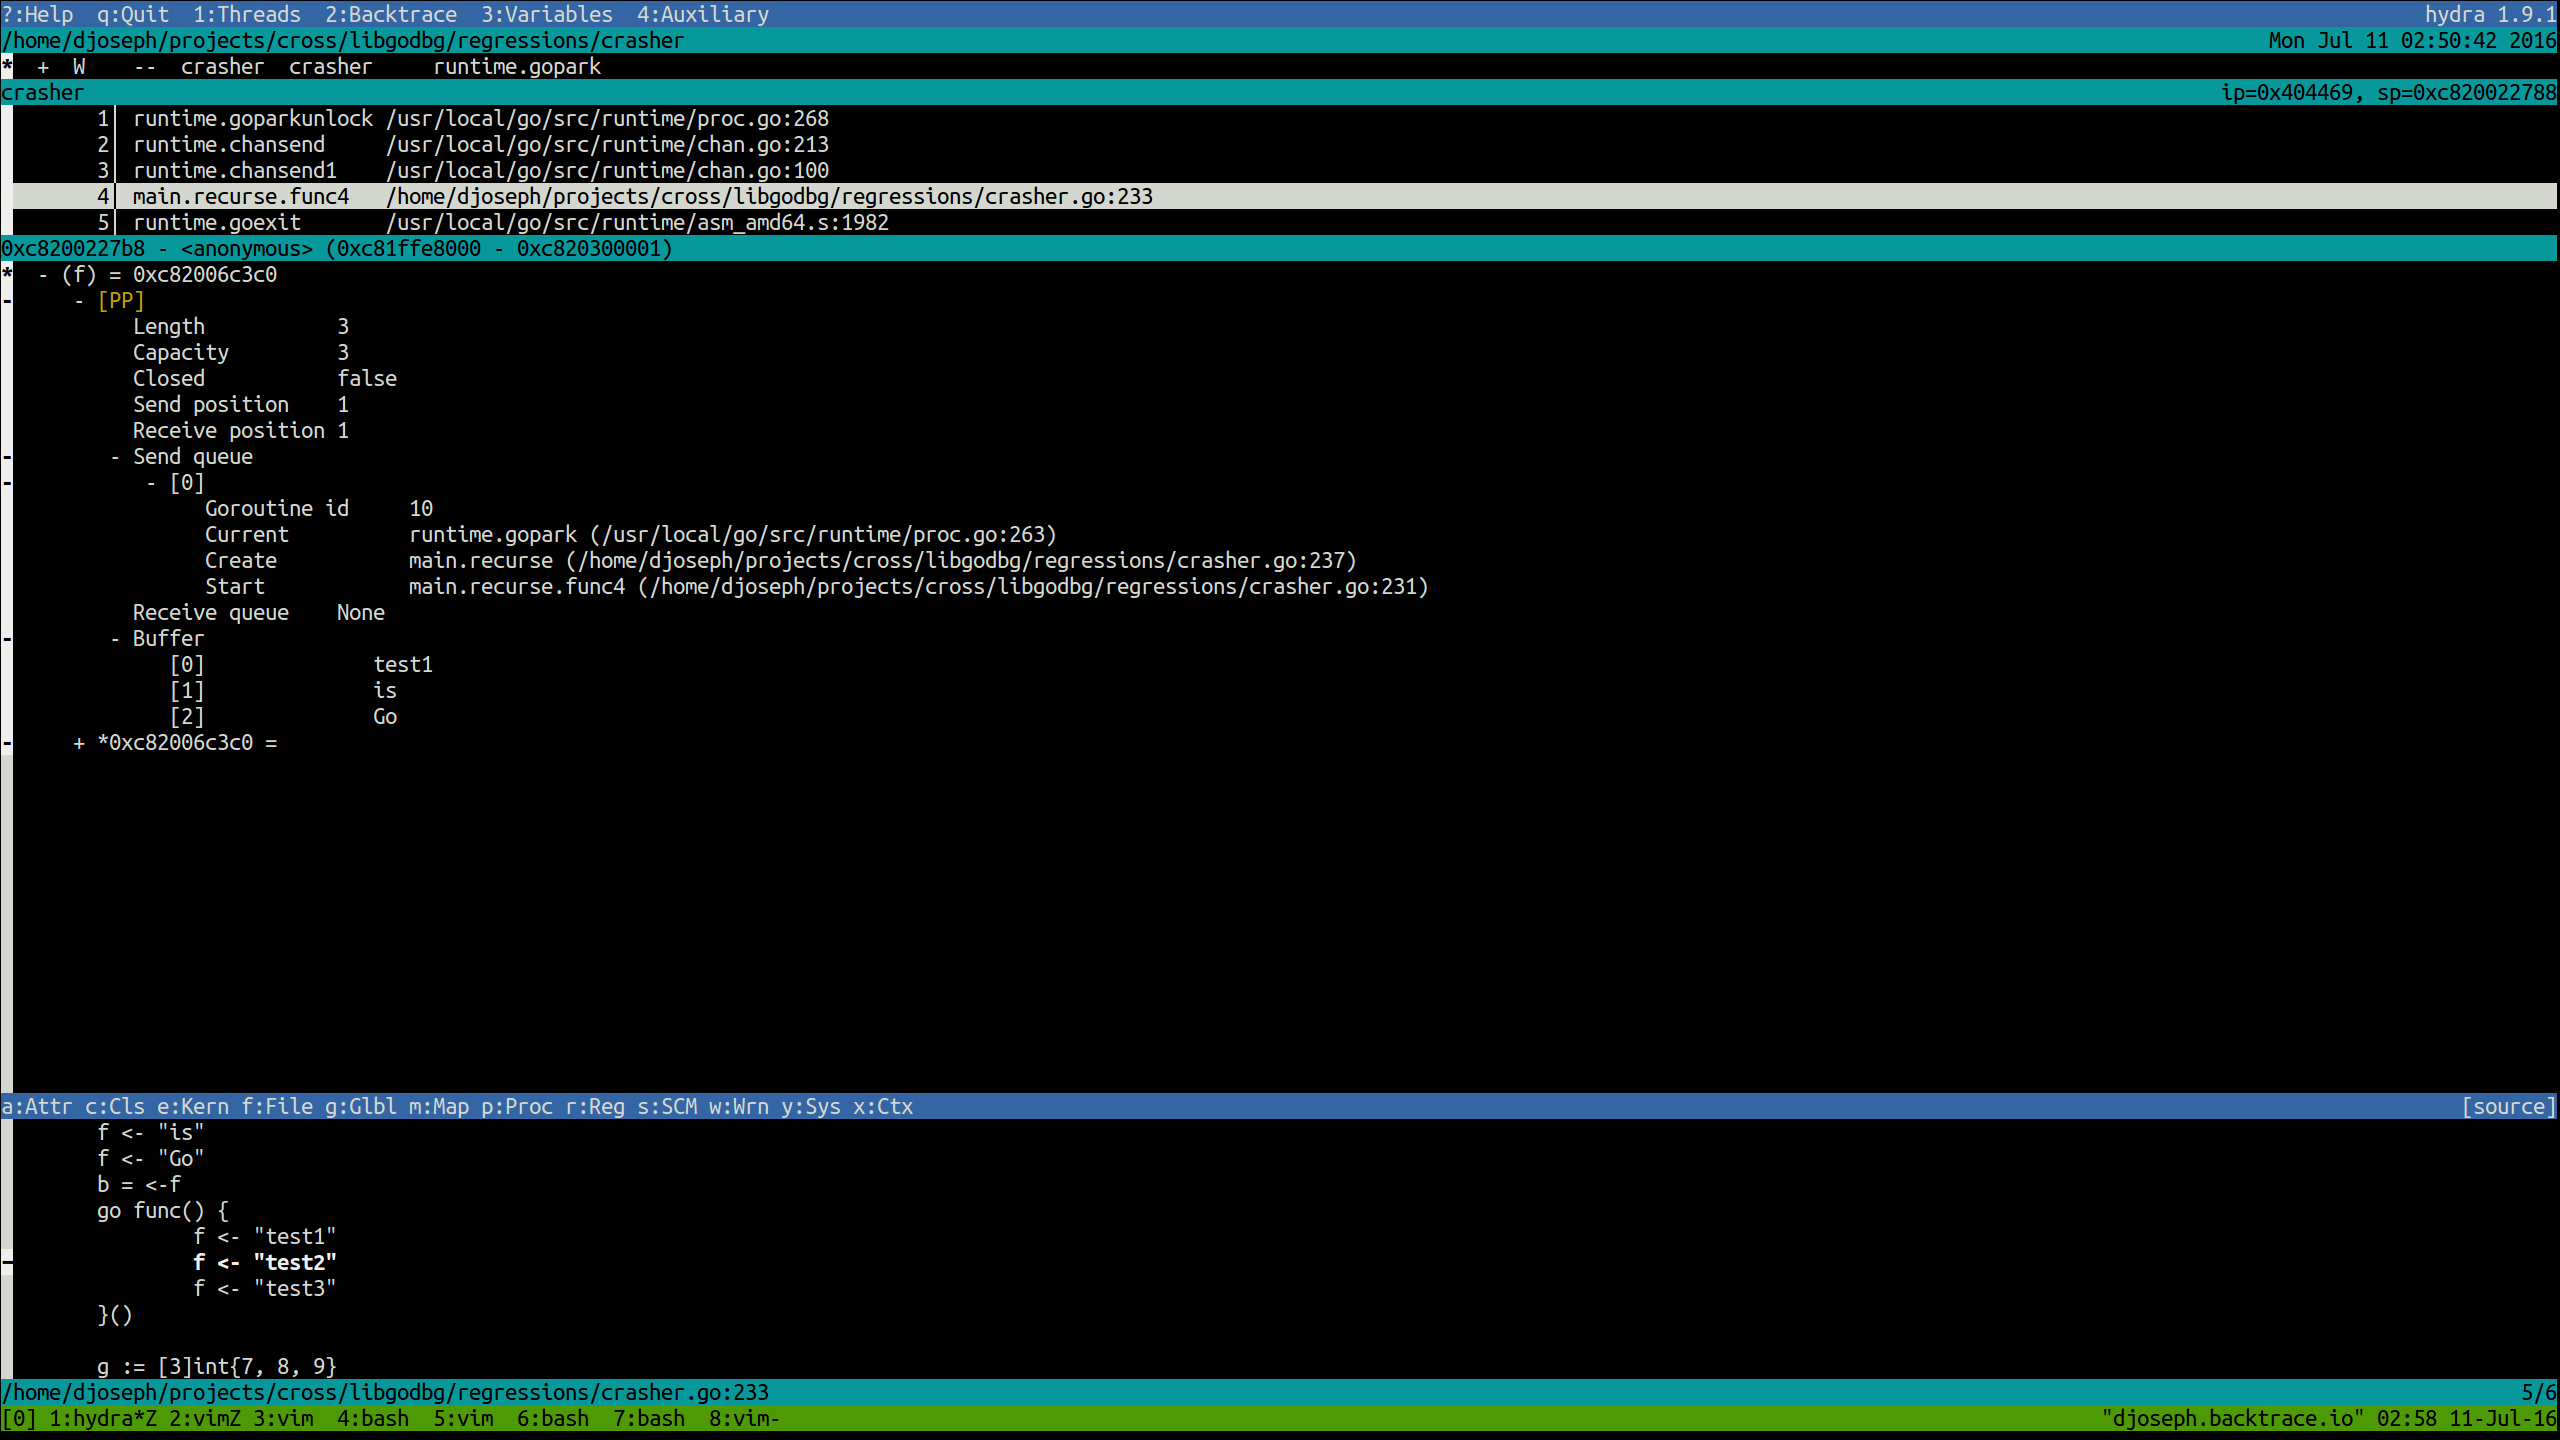
- Channels
- Length (current number of elements in the channel’s ring buffer)
- Capacity (total size of the buffer)
- Status (closed vs. open)
- Send and receive positions (the next storage and consumer indices)
- Buffer (if one exists) and its currently held elements
- Send and receive wait queues (i.e. relevant information about the goroutines waiting to send to and receive from this channel; at least one of these queues will be empty).
All types with some notion of a length attribute (string length, map element count, channel waitqueue size) will be capped to a configurable upper bound.
Goroutines
Go implements a concurrency model that’s different than that used by processes
for which general-purpose debuggers, like gdb, are built; extension modules
must be provided for complete support. One major issue from the debugging
perspective arises from the 1:1 threading model (what typical POSIX-threaded
applications use) vs. the M:N threading model (what Go uses), or in the context
of this post, goroutines. Any debugger for Go must account for the differences
between userspace goroutines and kernel-level OS threads.
With our latest release, we do.
Threads may be grouped by their type – userspace, or goroutines, vs. kernel – using hydra, our terminal interface for viewing snapshots. Goroutines started and used by Go’s runtime, like garbage collection mark workers, may be filtered out by request, leaving you with just your own live goroutines to scour. Each goroutine’s status, current kernel thread ID (assuming the goroutine currently has a thread), and annotated metadata will be shown.
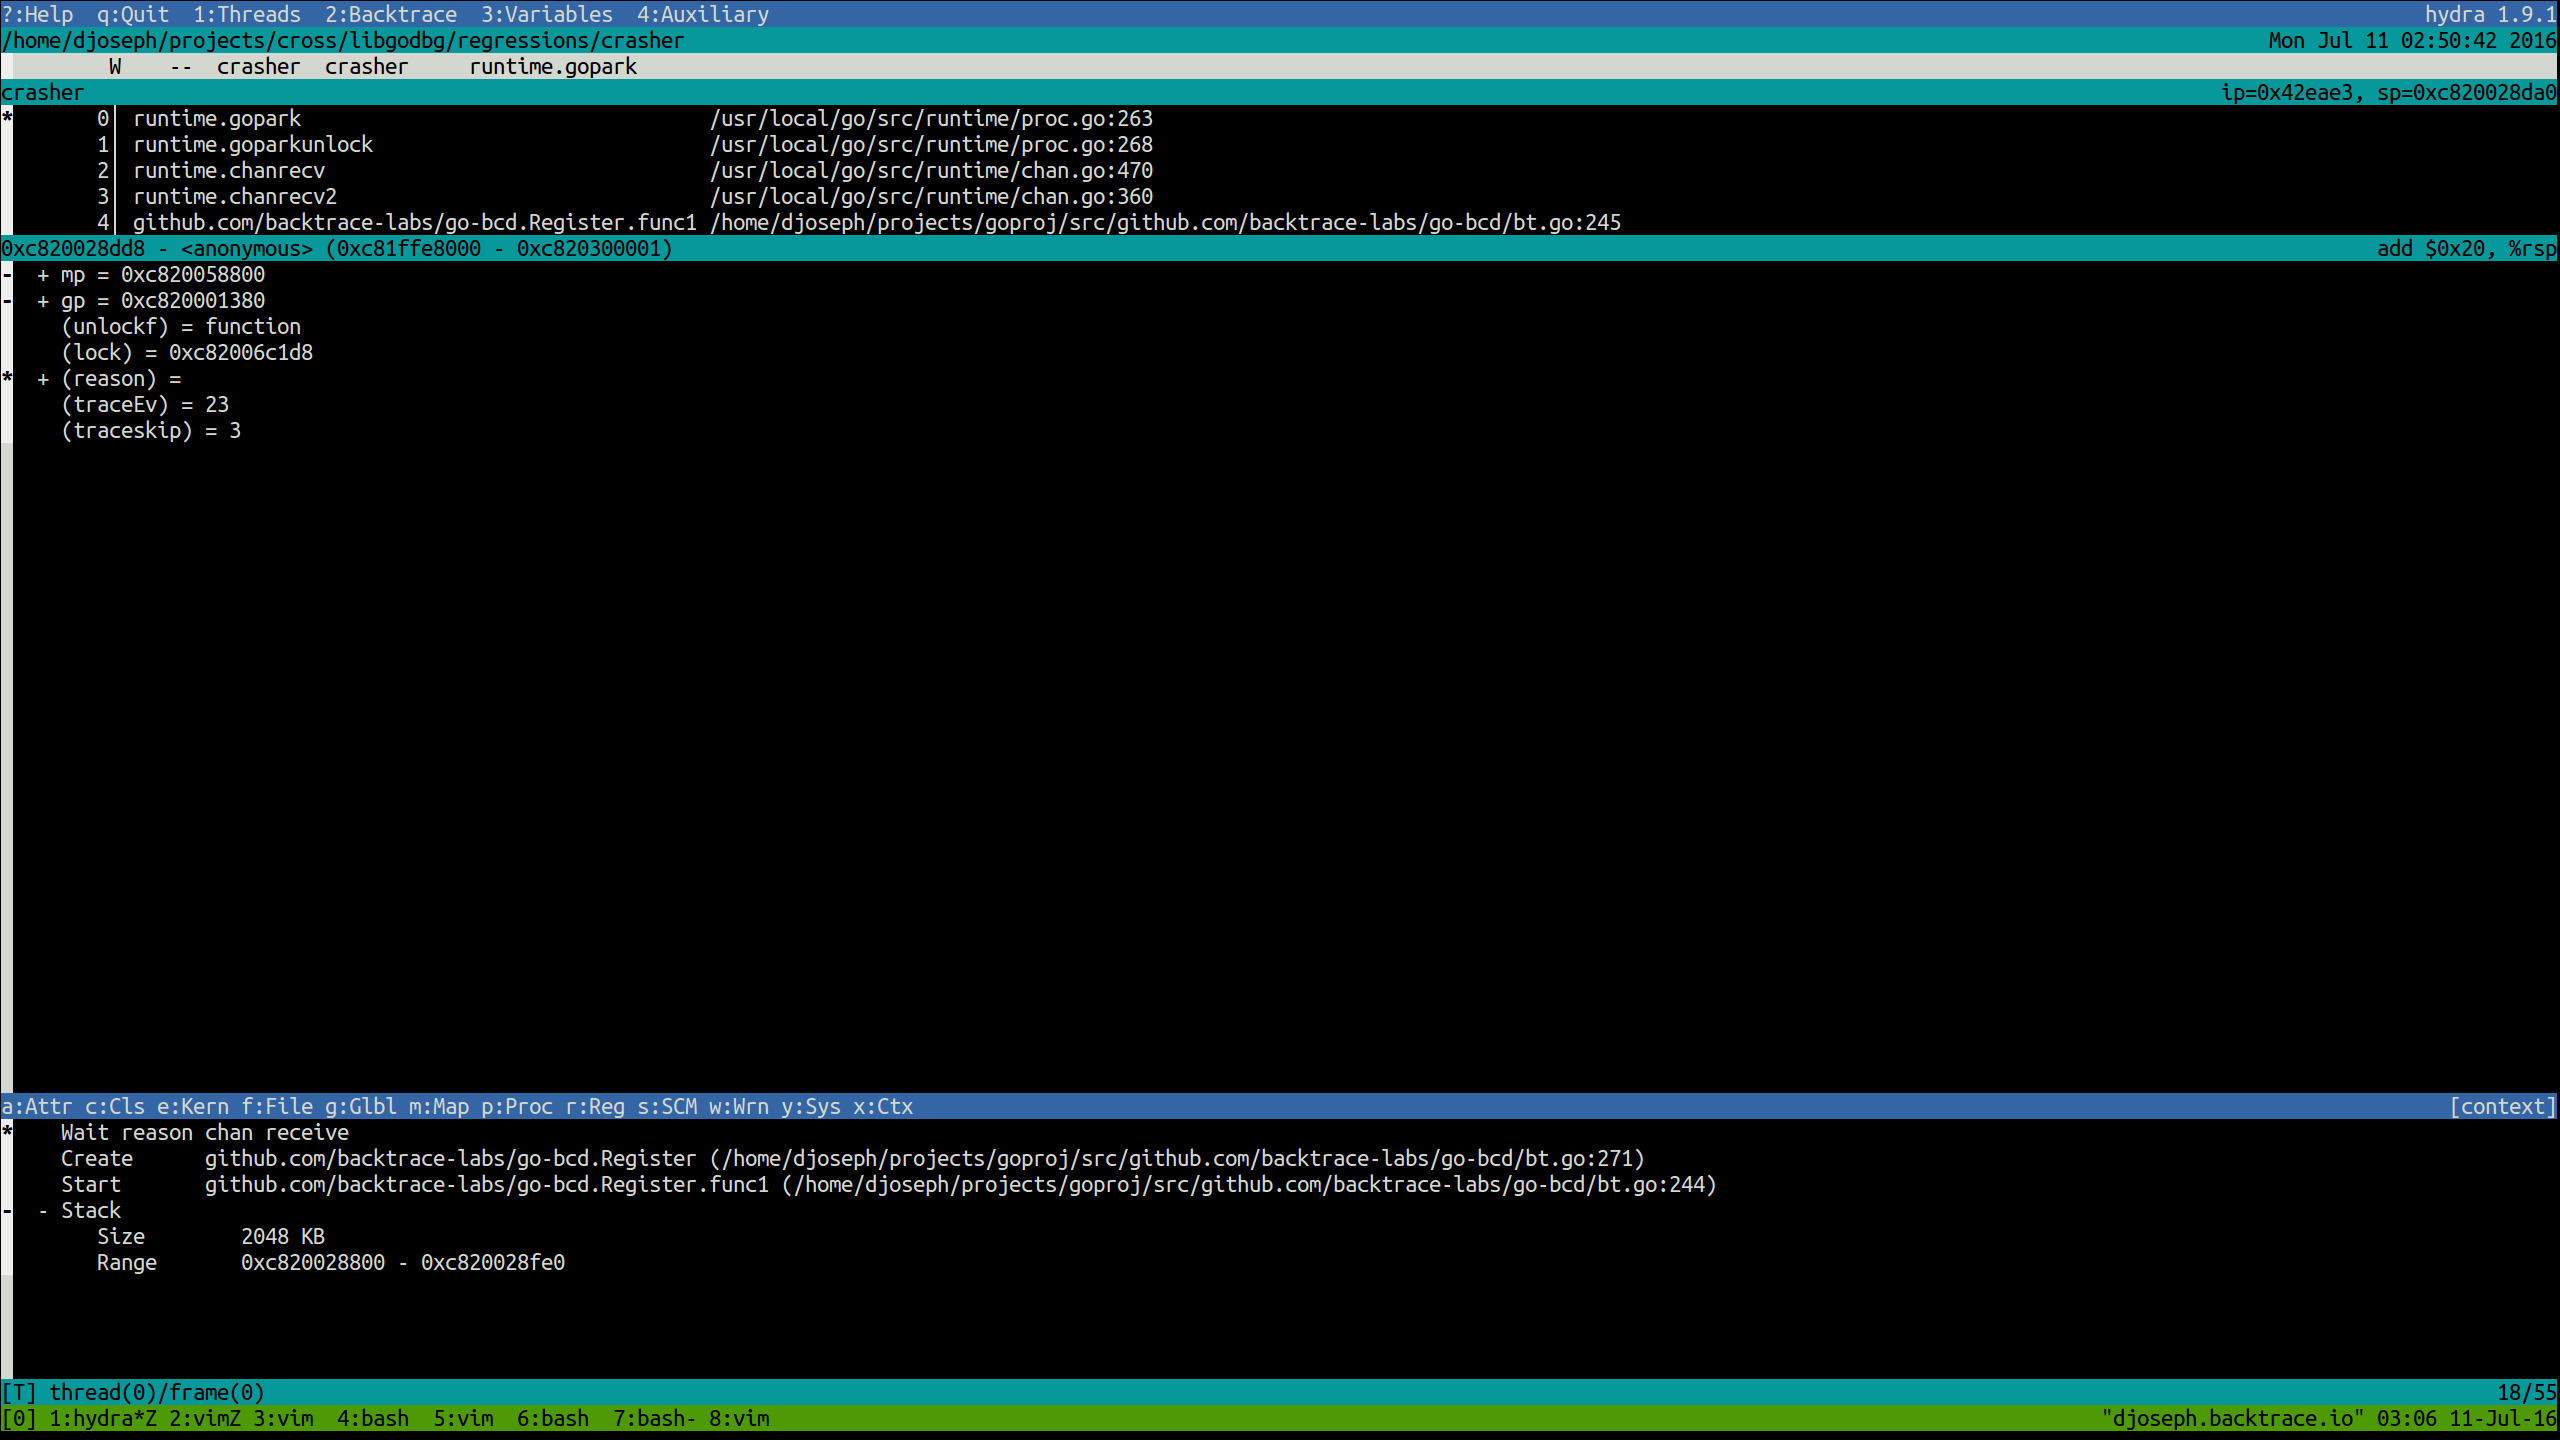
Goroutine metadata will include:
- Creation statement: the Go statement that created the current goroutine.
- Starting function: the starting function of the current goroutine.
- Wait reason: the reason for blocking if the goroutine is in a waiting state (e.g. chan receive, IO wait, etc.).
- Wait duration: the duration the goroutine has been waiting if it is in a waiting or syscall state.
- Stack size and address range: the current stack allocation of the goroutine.
Scheduler
Sometimes a list of goroutines and their callstacks, even with all their variables pretty-printed, isn’t enough. Goroutines may not be executing when they are expected to, or their rates of execution may be lower than desired.
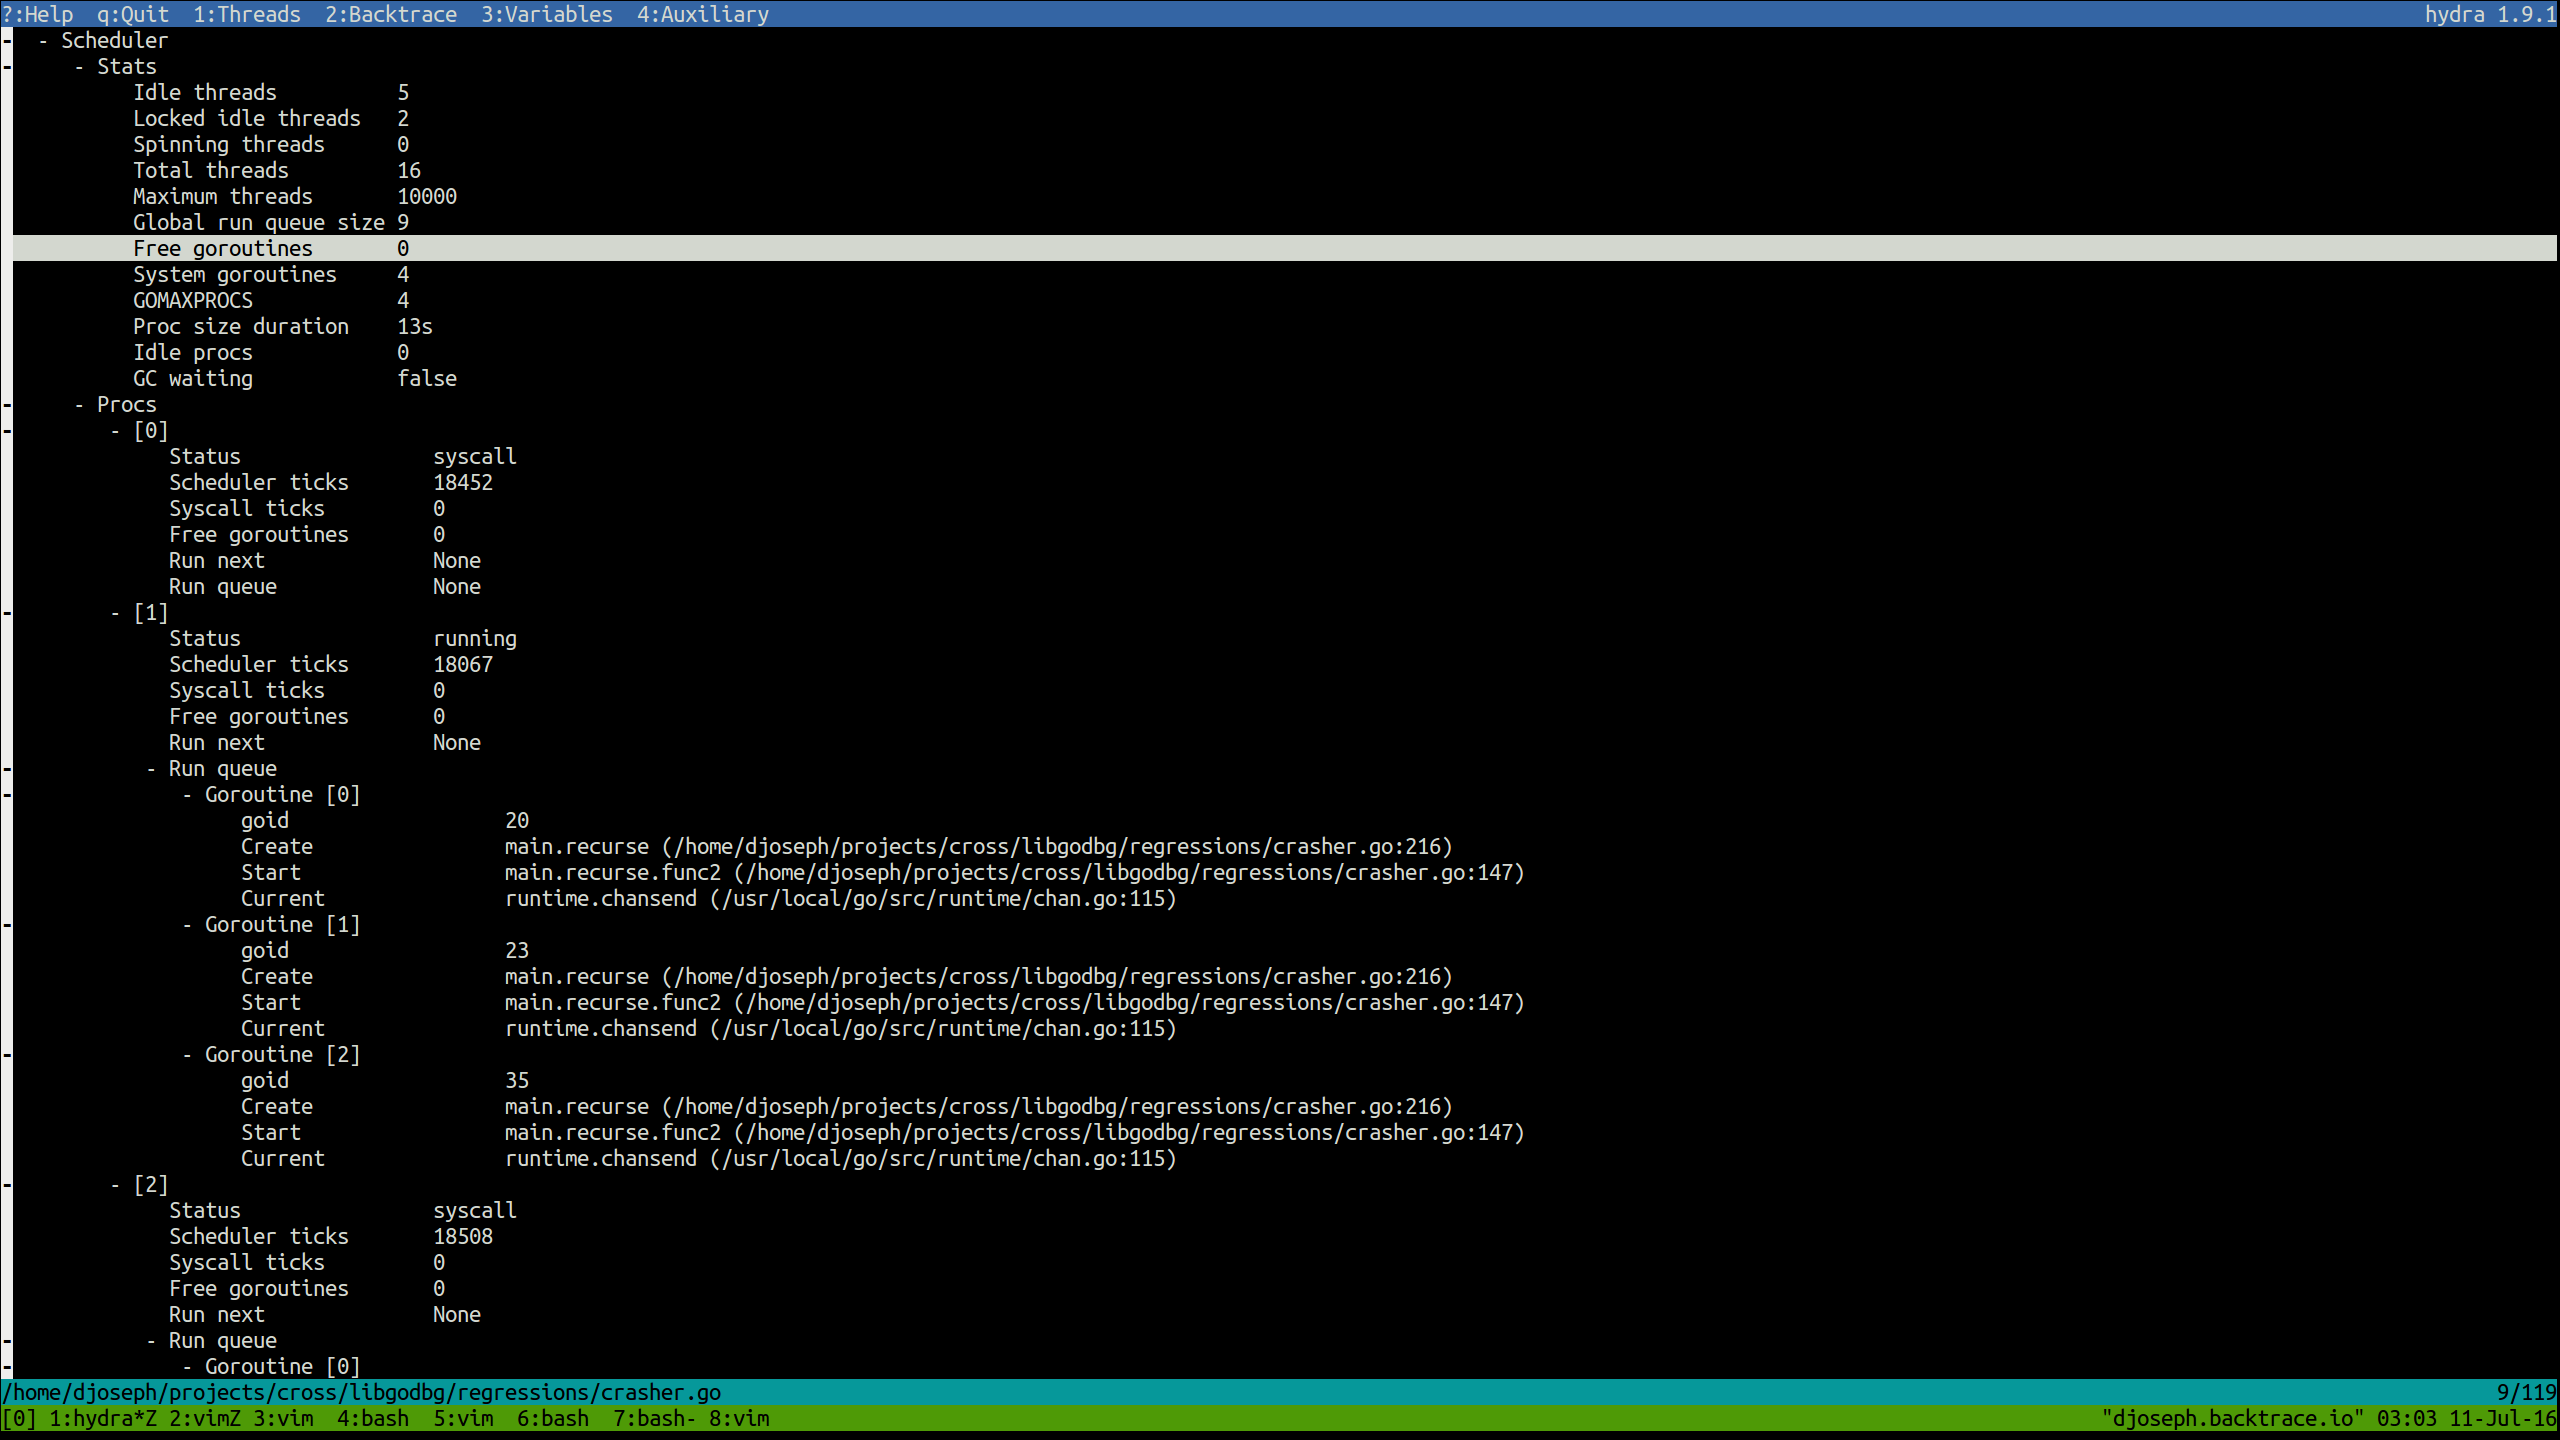
Gaining insight into these situations requires deeper introspection into Go’s runtime, so we provide more than just callstacks and variables. Global runtime scheduler stats and information for each processor, such as the per-processor run queues, will also be extracted.
For information about the runtime scheduler and definitions of various terms,
see the
scheduler design doc
and runtime/proc.go.
Below, process refers to Go’s runtime scheduler object, or a resource required
to execute Go code. There are exactly GOMAXPROCS processors.
Goroutines in per-process and global run queues will be
displayed using their identifying information (namely, the statement that
created the goroutine, the starting function, and the current instruction) in
the order in which the scheduler will run them. Any goroutines intended to share
the current goroutine’s scheduled timeslice will be noted (by Run next).
Curious why a goroutine you expect to be running isn’t? Check the scheduler output. There may be many goroutines queued to run before it. Perhaps one processor is overloaded and goroutine-stealing by other processors hasn’t occurred, yet. The goroutine in question may not be runnable at all, and thus wouldn’t be in a run queue – check the global thread list for waiting goroutines (for those curious about where waiting goroutines are actually stored in the Go runtime (if at all), follow our blog – a subsequent post will explain these implementation details).
go-bcd
All of this information is less useful if actually extracting it from your
application is difficult, so we provide an open-source package,
go-bcd, to allow Go programs
to easily request traces on demand or in response to panics. Worried about
unhandled panics? Just enable core dump generation (e.g. with
GOTRACEBACK=crash) and let our
coresnap daemon do the rest.
A minimum example application of snapshot generation is shown below; the github repository contains a more complete example and readme.
package main

import (
	"github.com/backtrace-labs/go-bcd"
)

func main() {
	// This is optional.
	// Call this if kernel.yama.ptrace_scope will prevent child processes
	// from tracing their parents and other means of adjustment are not
	// preferred.
	if err := bcd.EnableTracing(); err != nil {
		panic(err)
	}

	// Create a new tracer using the default implementation, which uses
	// the Backtrace I/O suite of tools.
	// The first argument indicates whether system goroutines should be
	// included.
	tracer := bcd.New(true)

	// Enable automatic uploads of generated snapshots to a remote coronerd
	// object store for aggregation and querying. Alternatively, one may
	// use a coroner daemon process to monitor a directory for snapshots.
	// See https://documentation.backtrace.io/ for more details.
	if err := tracer.EnablePut("https://fakeserver.fakecompany.com:6098",
		"fakeprojecttoken",
		bcd.PutOptions{Unlink: true}); err != nil {
		fmt.Printf("Failed to enable put: %v\n", err)
	}

	// Synchronously request a trace. This may also be called from a newly
	// spawned goroutine.
	bcd.Trace(tracer, nil, nil)
}
Conclusion
In this post, we’ve highlighted some of the benefits that come from Backtrace’s first-class Go support. Scheduler introspection, data structure pretty-printing, and goroutine metadata are just a few of the insights we provide. All of this seamlessly plugs into our existing platform, improving and automating the way you and your team handle errors.
We’ll follow this post with another on the implementation behind these features and some of the hairy bugs encountered along the way.
Want to try this on your Go apps? Sign Up for a free trial or email us.