If you read our previous posts of Memory Management Bugs: An Introduction and Post-Mortem Memory Debugging, you have an idea how Backtrace may help debugging various memory errors. In this post, I will illustrate how it works under the hood with the example of TCMalloc, one of the memory allocators supported by Backtrace.
TCMalloc Internals
The primary goal of TCMalloc is high performance of memory allocations, especially for memory intensive applications in multi-threaded environment. The motivation is manifested in its implementation of thread cache, size class and lock reduction.
The following figure shows the architecture of TCMalloc. The thread cache on the right side of the figure serves the memory allocation of small sizes, which constitutes the majority of memory requests for almost all applications. The thread cache is a TLS (thread local storage) object which requires no lock at all. On the left side is the central heap component which is the layer interfacing with OS kernel. It requires global locking since it is shared by all threads. Memory is managed in unit of logical pages at this level. A group of contiguous pages is called span. Central heap maintains a map of all spans and is responsible to supply a free span when requested. Large size memory requests are fulfilled by the page allocator of this component. Central free list serves as the middleman between central heap and thread cache which carves spans into small pieces to replete thread cache in anticipation of user requests. It also receives freed memory from thread cache when there are too many and returns it to central heap if the whole span is free.
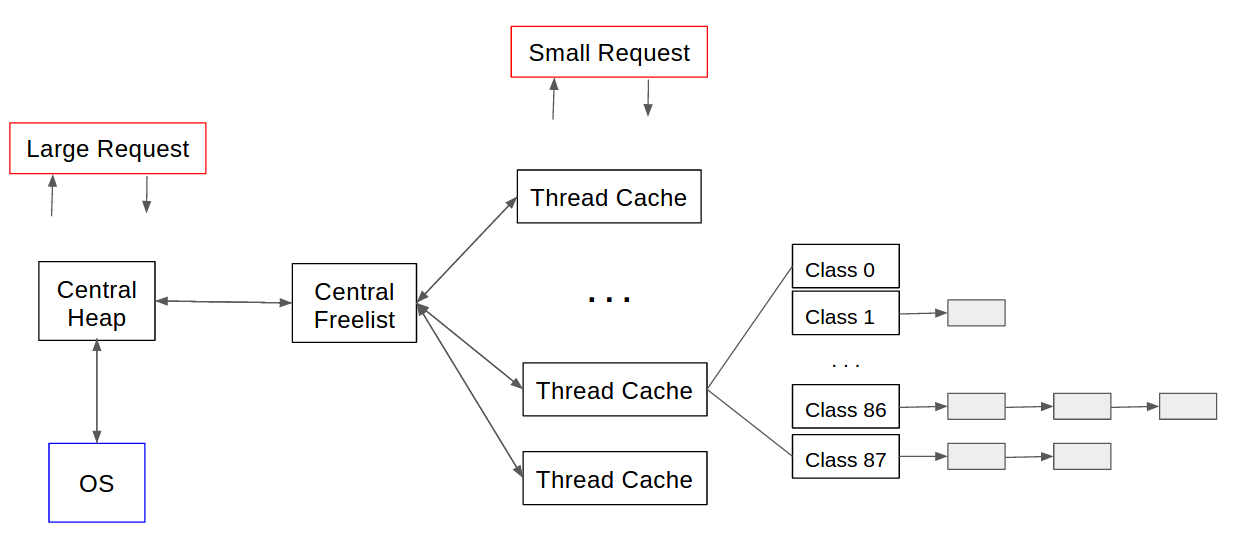
Memory size class is used to reduce many possible request sizes to a much smaller set of fixed sizes. A span is typically carved into an array of equally-sized memory regions that belongs to one of the classes. Since they are of uniform size, one single metadata is sufficient to record the size for all regions in the span. This reduces the space overhead of heap data. It also speeds up memory free operation because freed regions are not coalesced. The benefit comes with the potential memory waste when application requests a wide range of size classes and doesn’t use all regions in some spans because memory regions of one class can’t be allocated to another class. The thread cache for each application thread is essentially an array of lists of cached memory regions indexed by size class. Central free list is also an array of objects for each size class. Because of this, fine-grained locking is possible. Two threads may request central free list to fulfil their cache list without mutually locking out each other as long as their requested sizes are not the same class.
Examples of Memory Errors
Though all documents state that the consequence of memory errors such as double free, invalid free or memory overrun is undefined, it is interesting and sometimes useful to know the symptom specific to a memory allocator because it may explain the observed behavior and provide plausible theory. The following examples are particular to TCMalloc’s implementation.
The first example shows a double-free error. Memory region pointed by p is
freed twice without observable failure, which results the following two
allocations of the same size return the same address to two variables. As a
matter of fact, it will return the same address to infinite number of requests
of the same size. The reason, TCMalloc uses a singly-linked list to cache freed
memory regions with link pointer inside the free region itself. Allocation is
simply pop off the head of the list and move the head to the next node on the
list. In case of this simplified scenario, the double-freed region has the link
pointer points to itself and causes the head pointer stuck to this region. In
reality, an application is likely to write data into the allocated memory and
overwrite the link pointer which breaks the circular link. However, it is
unavoidable that the region is allocated at least twice to two different
requests. From application’s point view, it appears that allocator erroneously
allocates the same memory region to two different variables which causes
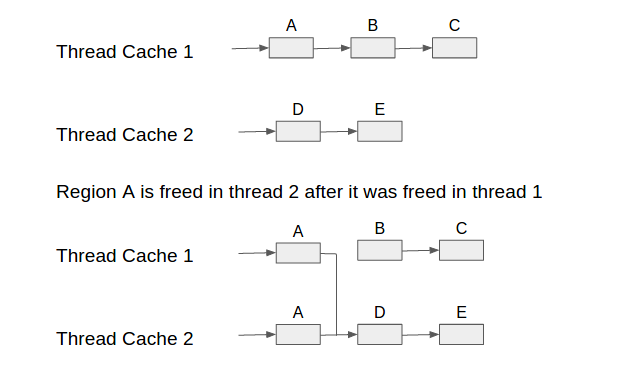
unpredictable consequences. The situation may be even more perplexing if the
same memory region is freed twice in different threads. It will be linked in
the free lists of these two thread’s cache and crosses each other due to
sharing the same node unwittingly. As shown in the figure, region A is first
freed and linked in thread 1’s cache. However, it is freed again in thread 2
which is put on the thread’s free list. This causes thread 1’s cache shares
with thread 2’s while regions B and C are leaked.
        void *p, *p1, *p2;
        p = malloc(8);
        free(p);
        free(p);
        p1 = malloc(8);
        p2 = malloc(8);

        (gdb)print p
        $1 = (void *) 0xf16008
        (gdb)print p1
        $2 = (void *) 0xf16008
        (gdb)print p2
        $3 = (void *) 0xf16008
The next example relates to an invalid free pointer, i.e., the pointer that is
passed to free function is not the address returned by corresponding malloc
function. As you can see, the parameter passed to free function, 0xf1600a, is
two bytes after the correct address 0xf16008. TCMalloc doesn’t crash or fail
in the free function. Instead it pushes the invalid free pointer to the thread
cache’s free list and pops it off in the next memory request. Therefore, p2
gets the invalid address which is improperly aligned and is doomed to overrun
its boundary by two bytes.
        void *p1, *p2;
        p1 = malloc(8);
        free((char *)p1 + 2);
        p2 = malloc(8);

        (gdb)print p1
        $1 = (void *) 0xf16008
        (gdb)print p2
        $2 = (void *) 0xf1600a
The last example is an off-by-one error which overruns the allocated memory
region by one byte. The program crashes in the next malloc function call. The
backtrace suggests heap data corruption. We don’t need to care about the detail
of the heap data involved. In short, the memory region after what is allocated
to variable p is free and on span’s free object list. The one byte overwrites
the link pointer embedded in that region and causes the crash soon after.
        const size_t sz = 8;
        char *p, *p2;

        p = (char *)malloc(sz);
        p[sz] = '\0';
        p2 = (char *)malloc(sz);

        $bt --minidump --core core.7958 tcmalloc_test
        PID: 7958
        --------------------------------------------------------------------------------
        Thread 7958
          [  0] libtcmalloc.so.4.3.0      tcmalloc::SLL_SetNext(void*, void*) (src/linked_list.h:49)
          [  1] libtcmalloc.so.4.3.0      tcmalloc::CentralFreeList::FetchFromOneSpans(int, void**, void**) (src/central_freelist.cc:314)
          [  2] libtcmalloc.so.4.3.0      tcmalloc::CentralFreeList::FetchFromOneSpansSafe(int, void**, void**) (src/central_freelist.cc:282)
          [  3] libtcmalloc.so.4.3.0      tcmalloc::CentralFreeList::RemoveRange(void**, void**, int) (src/central_freelist.cc:264)
          [  4] libtcmalloc.so.4.3.0      tcmalloc::ThreadCache::FetchFromCentralCache(unsigned long, unsigned long) (src/thread_cache.cc:126)
          [  5] libtcmalloc.so.4.3.0      tcmalloc::ThreadCache::Allocate(unsigned long, unsigned long) (src/thread_cache.h:368)
          [  6] libtcmalloc.so.4.3.0      (anonymous namespace)::do_malloc_small(tcmalloc::ThreadCache*, unsigned long) (src/tcmalloc.cc:1193)
          [  7] libtcmalloc.so.4.3.0      (anonymous namespace)::do_malloc(unsigned long) (src/tcmalloc.cc:1200)
          [  8] libtcmalloc.so.4.3.0      (anonymous namespace)::do_malloc_or_cpp_alloc(unsigned long) (src/tcmalloc.cc:1219)
          [  9] libtcmalloc.so.4.3.0      tc_malloc (src/tcmalloc.cc:1603)
          [ 10] tcmalloc_test             buffer_overrun() (main.cpp:112)
          [ 11] tcmalloc_test             main (main.cpp:122)
          [ 12] libc-2.23.so              __libc_start_main
The behaviors shown in the above examples are related to the singly-linked list used in TCMalloc for various free lists. Other allocators may manifest the same error in different symptoms.
Backtrace’s Post-Mortem Analysis of TCMalloc Heap
Backtrace’s heap module supports several popular allocators like JEMalloc,
PTMalloc and UMA. TCMalloc is the latest addition to the group.
It starts by looking for the global variables of the allocator such as
tcmalloc::Static::pageheap_, tcmalloc::Static::central_cache_, etc. Then it
parses the heap data according to the type information of debug symbols. While
it scans the whole heap metadata, inconsistency due to memory errors is found
and reported. For example, a double-free incident will leave the same heap
region twice in one or more thread caches or central free list if they are not
yet reused. Backtrace parses these free lists and reports a double-free
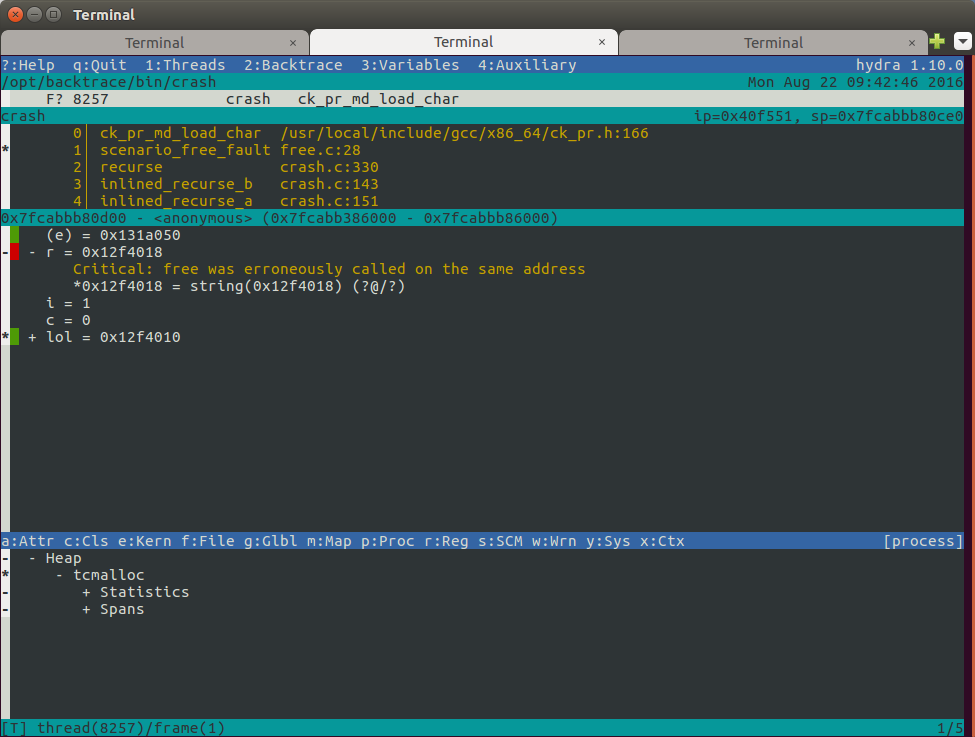
error if duplicates are found. The following picture shows an example in
Backtrace’s snapshot viewer hydra. Notice the message in the middle pane
“Critical: free was erroneously called on the same address”. The bottom pane
lists the heap statistics and summary of important heap metadata.
Conclusion
Normally, it is not required for a developer to understand a memory allocator inside out. In most cases, it is also impractical to manually check heap data. However, this is crucial information needed in order to interpret the observed signals and relate them to application errors. Backtrace fills this gap by reducing the complexity of a memory allocator’s implementation, finding critical inconsistency in heap data, and reporting the errors from the user’s perspective. When combined with Backtrace’s classifiers, this becomes even more useful by identifying patterns that point to the source of the bug.
To learn more about Backtrace, check out other posts in our blog or request a free trial of our product.