We’ve previously posted a few blogs covering memory management, memory bugs, and post-mortem memory analysis. Now, we are excited to add another memory debug tool to Backtrace’s offering: stale pointer analysis. In this post, I will explain how this analysis works, its strengths, and its limitations.
Introduction
Among many memory errors, stale pointer is one of the subtlest and most difficult to debug. It happens when a memory region is freed or reallocated but the old references, aka aliases, to the memory are not updated properly. Usage thereafter of these stale references causes unpredictable consequences. It may be benign; it may trigger intermittent failure, or outright crash. Even if there isn’t any observable error, it is a ticking time bomb. With slight context change or a small new code added, it may become catastrophic. With multi-threaded programs, race conditions usually result in stale pointers which add another dimension of complexity to debug.
As an example of stale pointer, let’s take a look at the following code snippet.
struct student {
	int id;
	char *name;
};

struct team_member {
	int position;
	char *name;
};

char *name_buffer;
const size_t buff_sz = 256 * 1024;

void
register_student(struct student *stu)
{

	stu->id = 123;
	stu->name = name_buffer;
	strcpy(stu->name, "Jack Smith");

	//do something

	free(stu->name);
}

void
join_team(struct team_member *member)
{

	member->position = 0;
	member->name = name_buffer;
	strcpy(member->name, "Janet Snow");

	//do something

	free(member->name);
}

void
stale_pointer_test(void)
{
	struct student *s;
	struct team_member *m;

	name_buffer = (char *)calloc(1, buff_sz);

	s = (struct student *)calloc(1, sizeof *s);
	register_student(s);

	m = (struct team_member *)calloc(1, sizeof *m);
	join_team(m);
}
The memory bug is obvious here. Function register_student uses memory pointed
to by name_buffer and frees it after it is done. Function join_team tries
to do similar thing but runs into trouble when using the already freed
name_buffer. This code will crash on RedHat Linux because the memory pointed
to by name_buffer is returned to kernel when it is freed. The system memory
allocator ptmalloc allocates memory directly from kernel and returns to it
after the user frees the memory if the memory request is larger than the tuning
parameter mmap_threshold (128 KiB by default.) Other OSs and their allocators may
have different policies and implementations. Therefore, user could see totally
different symptoms. The above example is overly simplified for the purpose of
this illustration, the real stale pointer bugs in the wild are much more complex
and difficult to debug. For example, function register_student and
join_team may be invoked in different threads with improper synchronization.
The execution of the code is transient and difficult for the user to understand
the sequence of events that leads to the final crash.
A Practical Approach to Detect Stale Pointer
It is difficult to debug issues like stale pointer in practice. To prevent it from happening, a user may avoid aliasing, ensure no more reference to freed memory, for instance, by using reference counting, or manage objects with garbage collection, etc. But these are not a solution to all applications.
Backtrace added a new feature to detect and analyze stale pointer in its recent release. As a post-mortem tool, it adopts a different approach than the aforementioned methods. The basic idea is actually simple. For crashes due to invalid memory access, the address of the memory must come from the value of a variable or the value of a variable’s direct or nested data member. The invalid memory address is set incorrectly through the reference of the variable. Finding the variable with the reference could lead to the root cause of the crash. If it points to a freed memory region, it is a stale pointer.
The concept is not new. As a matter of fact, it is commonly used in interactive debugging. A developer would normally review a faulting thread’s backtrace and inspects local variables to figure out their relationship to the crash. This is sufficient in some cases but often unsuccessful for tough issues such as stale pointer. The culprit that we look for may be present in another thread like in a race condition, it may be a global object or it may belong to a heap object that indirectly references the fault memory address. For any nontrivial program, it is impossible to exhaust all possibilities manually, i.e. by inspecting variables and heap memory regions in an interactive fashion, not to mention that it is boring and prone to human error. Backtrace’s stale pointer module scans the whole address space of the target process to extract all back references to the fault memory address. The scanning may be repeated a couple of times for indirect back references. Then it analyzes and symbolizes them in order to put them in the context of the program source. For example, global and local variables are annotated with the compilation unit or thread and stack frame where they belong to, as well as their names and values including elements and data members for aggregated types. However, it is more likely that a back reference belongs to a heap object since most variables and objects are allocated dynamically from heap. It is crucial to know what these objects are and how they are used in the context. Heap objects present a challenge for symbolification. First, a heap object has no debug symbol emitted by the compiler. Secondly, a debugger can’t help unless it is referenced by a local or global variable, which isn’t always true considering there are thousands or even millions of heap objects.
Backtrace overcomes this difficulty by leveraging the heap and object type information which are retrieved by other components of Backtrace. The Backtrace heap module analyzes the metadata of memory allocator and tells us if a heap region is free or in use given any heap address. For a heap region that has a back reference to the fault memory address, it may reveal a stale pointer bug if the region is free; if it is in use, a bug may still set the invalid address through the reference. To identify such a heap object, Backtrace first determines the size of the heap region and reads its data content. The data pattern is analyzed and pointer values, i.e. valid memory addresses that fall in the target’s address space, are picked out as the signature of the object. Assumption is that these values are pointer-typed data members of the object. This information is then combined with the knowledge of data types declared by the compiler, for example, through DWARF debug symbols. The result is a reasonably short list of object types that the heap object might belong to. The user may use the clue to review source code for potential bug related to the object.
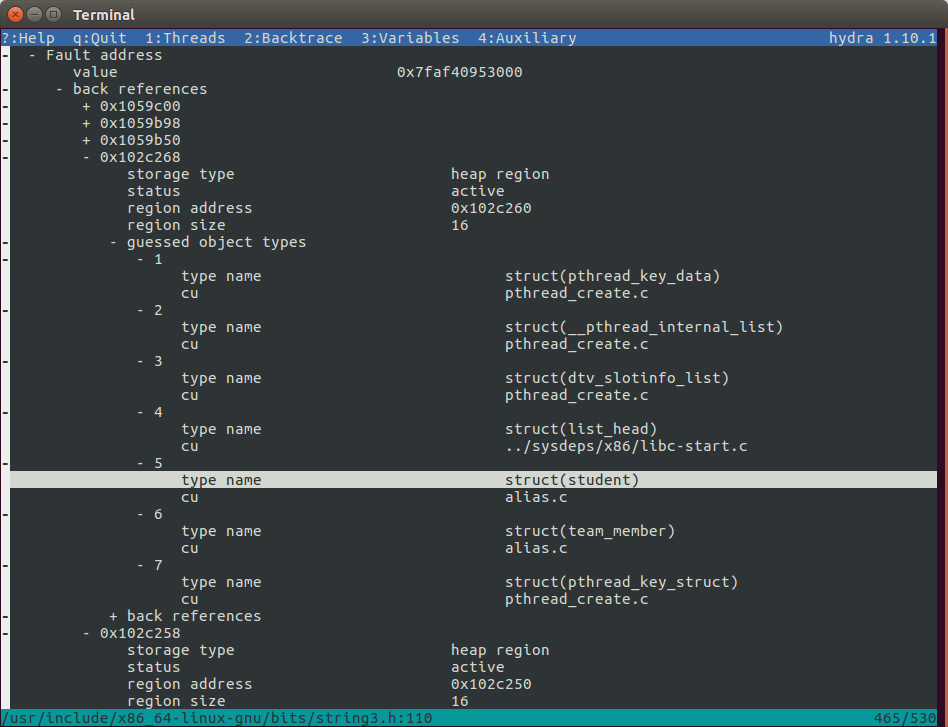
Let’s see an example with the previous code snippet. The following figure shows
the result of stale pointer detection. The program crashed while accessing
memory address 0x7faf40953000. After scanning the process’s address space, we
found five back references. One of the back reference occurs at 0x102c268.
Heap analysis reveals that this is an active region with size of 16 bytes and
starting at address 0x102c260. There are many data types that could result in
the allocation of 16 bytes of heap memory (This also depends on the
implementation of particular memory allocator besides the type itself.) But
only a fraction of them have a pointer value as its data member at the offset
of 8 byte. Backtrace’s type identification lists seven possible object types.
If we ignore the types of system libraries, there are only two types left,
struct student and struct team_member. The user is prompted to review the
source code related to the variables of these types, especially the data member
which references the fault memory address.
Limitations
There are some limitations to this approach. The memory scan has a significant impact on performance due to the full scan of process’s address space. Our test shows a linear relationship of response time to the total amount of mapped memory of the target process. The effectiveness of this approach relies on the fault memory address itself. If the program faults on an address that is a common value, there will be too many false positive back references to be useful. As an extreme example, a crash due to dereference of NULL would render the feature useless because NULL pointer, i.e. value 0, would generate numerous back references where most of them are unrelated.
Conclusion
Debugging stale pointer bugs is challenging; there is no silver bullet. However, Backtrace provides a practical feature to find all back references to an invalid memory address. Combined with the heap analysis module embedded in Backtrace, it is hopeful to find the heap object that is freed but still referenced by active variables, and how they are related to the faulted memory address. This may be just the tool you need when others fall short.
To learn more about Backtrace, check out other posts in our blog or request a free trial of our product.