Have you ever had an assert get triggered only to result in a useless core dump
with missing variable information or an invalid callstack? Common factors that
go into selecting a C or C++ compiler are: availability, correctness,
compilation speed and application performance. A factor that is often neglected
is debug information quality, which symbolic debuggers use to reconcile
application executable state to the source-code form that is familiar to most
software engineers. When production builds of an application fail, the level of
access to program state directly impacts the ability for a software engineer to
investigate and fix a bug. If a compiler has optimized out a variable or is
unable to express to a symbolic debugger how to reconstruct the value of a
variable, the engineer’s investigation process is significantly impacted.
Either the engineer has to attempt to recreate the problem, iterate through
speculative fixes or attempt to perform prohibitively expensive debugging, such
as reconstructing program state through executable code analysis.
Debug information quality is in fact not proportionally related to the quality
of the generated executable code and wildly varies from compiler to compiler.
This blog post compares debug information quality between two popular
compilers: gcc and clang. In this blog post, we will introduce the topic of
optimization and highlight examples of their impact on debuggability. This blog
post is part of a longer series, in the next blog post we’ll do finer grained
analysis directly comparing gcc and clang in real world and synthetic programs.
Introduction
A compiler compiles source-code into executable code that interacts with memory, a limited set of registers and simplistic control structures such as conditional jumps. A compiler also emits debug information that enables a symbolic debugger to map the state of memory and registers back to a representation that includes source-code structure, variables and types. The format of this debug information is complex because it is designed to be as flexible as possible in order to support most programming languages, architectures and compiler optimizations. The format is actually turing-complete! If you want to learn more about debug formats, then I recommend the following resources:
- Implementing a Debugger: The Fundamentals
- Symbolic Debugging with DWARF
- Eli Bendersky’s blog
- The DWARF Specifications
The examples below are compiled with -O2 optimization levels.
Optimizations and debug quality
Different compilers emit debug information at varying levels of quality and accuracy. However, certain optimizations will certainly impact any debugger’s ability to generate accurate stack traces or extract variable values. This section briefly touches on some of these optimizations.
Variables and optimization
The compiler’s register allocator is responsible for allocating a larger number of program variables to a smaller set of processor registers. Register accesses are significantly faster than memory accesses, but the number of registers are scarce. Executable code will juggle between spilling (writing values from register to memory) and filling (reading from memory into registers) to efficiently make use of these registers. The value of a variable may exist in a register, in memory, a combination of the two or in debug information if it is a constant. If a compiler detects that the value of a variable is no longer needed (see live variable analysis), then the generated executable code may not save the value of the variable. In this situation, the variable is optimized out and the value is irretrievable.
Take the following program:
#include <ck_pr.h>
#include <unistd.h>

int
main(int argc, const char **argv)
{

    ck_pr_load_ptr(argv);
    pause();
    return 0;
}
In the above program, the value of argv is extracted and then the program is
paused. The ck_pr_load_ptr function performs a read from the region of memory
pointed to by argv, in a manner that prevents the compiler from performing
optimization on it. This ensures that the memory access occurs and for this
reason, the value of argv must be accessible by the time ck_pr_load_ptr is
executed.
When compiled with gcc, the debugger fails to find the value of the variable.
The compiler determines that the value of argv is no longer needed after the
ck_pr_load_ptr operation and so doesn’t bother paying the cost of saving the
value.
Below, we see the output of a debugger.
sbahra@skylake:~/projects/cdqs/src$ bt `pgrep spill` 2> /dev/null
PID: 4216
--------------------------------------------------------------------------------
Thread 4216
  [  0] libc-2.23.so              __libc_pause (../sysdeps/unix/syscall-template.S:84)
  [  1] spill_00                  main (spill_00.c:9)
     argc = -- [optimized out]
     argv = -- [optimized out]

  [  2] libc-2.23.so              __libc_start_main
However, if we modify the program to the following:
#include <ck_pr.h>
#include <unistd.h>

int
main(int argc, const char **argv)
{

    pause();
    ck_pr_load_ptr(argv);
    return 0;
}
The debugger is able to successfully extract the value, as seen below.
PID: 4462
--------------------------------------------------------------------------------
Thread 4462
  [  0] libc-2.23.so              __libc_pause (../sysdeps/unix/syscall-template.S:84)
  [  1] spill_00                  main (spill_00.c:8)
     argc = -- [optimized out]
     argv = (parameter) reference(0, 0x7ffe022232c8)
       {pointer(const char)} -><> = reference(0x7ffe022232c8, 0x7ffe02224433)
          {const char} -><> = string(0x7ffe02224433, 10, [./spill_00])

  [  2] libc-2.23.so              __libc_start_main
The executable code will also ensure the value of argv is saved and restored.
In this particular situation, when main is called, the value of argc is in the
%rsi register. The compiler will save the value of %rsi in the %rbx register,
whose value pause would be required to restore prior to return.
Dump of assembler code for function main:
   0x0000000000400430 <+0>:     push   %rbx
   0x0000000000400431 <+1>:     mov    %rsi,%rbx               # Save the value of argv in %rbx.
   0x0000000000400434 <+4>:     callq  0x400410 <pause@plt>
   0x0000000000400439 <+9>:     mov    (%rbx),%rax             # Load the value of argv.
   0x000000000040043c <+12>:    xor    %eax,%eax
   0x000000000040043e <+14>:    pop    %rbx
   0x000000000040043f <+15>:    retq
Call stack and optimization
Some optimizations generate executable code whose call stack cannot be sufficiently disambiguated to reconcile a call stack that mirrors that of the source program. Two common culprits for this are tail call optimization and basic block commoning.
Basic Block Commoning
Let’s examine how basic block commoning impacts the accuracy of extracting stack traces from the following program.
#include <ck_pr.h>
#include <stdlib.h>
#include <unistd.h>

static void
function(const char *string)
{

    ck_pr_load_ptr(&string);
    pause();
    return;
}

static int
f(int x)
{

    if (x == 1) {
        function("a");
    } else if (x == 2) {
        function("b");
    }

    return 0;
}

int
main(int argc, const char *argv[])
{

    return f(atoi(argv[1]));
}
If the program receives a first argument of 1, then function is called with
the argument of "a". If the program receives a first argument of 2, then
function is called with the argument of "b". However, if we compile this
program with clang, the stack traces in both cases are identical! clang
informs the debugger that the function f invoked the function("b") branch
where x = 2 even if x = 1.
sbahra@skylake:~$ bt `pgrep cbe_00` 2> /dev/null
PID: 14406
--------------------------------------------------------------------------------
Thread 14406
  [  0] libc-2.23.so              __libc_pause (../sysdeps/unix/syscall-template.S:84)
  |  1| cbe_00                    function (cbe_00.c:10)

  |  2| cbe_00                    f (cbe_00.c:21)

  [  3] cbe_00                    main (cbe_00.c:31)
     argc = -- [no location entry found: 0]
     argv = -- [no location entry found: 0]

  [  4] libc-2.23.so              __libc_start_main
With common block elimination, the compiler may combine the branches in
function into a single instruction. This means the stack is unwound to the same
instruction in both cases (identical line numbers in f regardless of whether
"a" or "b" is provided as input).
Tail Call Optimization
If the last operation executed in a function is a self-contained call to
another function, the compiler may have the executable code jump into the
target function without allocating additional stack space. In certain
situations, this will mean the debugger will not have sufficient information to
unwind the function call stack. Take the following program, where the function
factorial is implemented in tail recursive form.
#include <ck_pr.h>
#include <unistd.h>

static int
factorial(int vr_ac, int vr_n)
{

    if (--vr_n == 1) {
        pause();
        return vr_ac;
    }

    return factorial(vr_ac * vr_n, vr_n);
}

int
main(void)
{
    int vr_value;

    ck_pr_store_int(&vr_value, 10);
    return factorial(vr_value, vr_value);
}
When compiled with optimizations on in both gcc and clang, the debugger reports
the following call stack:
PID: 9373
--------------------------------------------------------------------------------
Thread 9373
  [  0] libc-2.23.so              __libc_pause (../sysdeps/unix/syscall-template.S:84)
  |  1| tco_00                    factorial (tco_00.c:9)
  [  2] tco_00                    main (tco_00.c:22)
  [  3] libc-2.23.so              __libc_start_main
The call stack should actually look like the following:
PID: 9385
--------------------------------------------------------------------------------
Thread 9385
  [  0] libc-2.23.so              __libc_pause (../sysdeps/unix/syscall-template.S:84)
  [  1] tco_00                    factorial (tco_00.c:9)
  [  2] tco_00                    factorial (tco_00.c:13)
  [  3] tco_00                    factorial (tco_00.c:13)
  [  4] tco_00                    factorial (tco_00.c:13)
  [  5] tco_00                    factorial (tco_00.c:13)
  [  6] tco_00                    factorial (tco_00.c:13)
  [  7] tco_00                    factorial (tco_00.c:13)
  [  8] tco_00                    factorial (tco_00.c:13)
  [  9] tco_00                    factorial (tco_00.c:13)
  [ 10] tco_00                    main (tco_00.c:22)
  [ 11] libc-2.23.so              __libc_start_main
The compilers were smart enough to eliminate the tail call and inline the function into the following loop:
[...]
   0x00000000004004d0 <+48>:    imul   %eax,%ebx
   0x00000000004004d3 <+51>:    sub    $0x1,%eax
   0x00000000004004d6 <+54>:    cmp    $0x1,%eax
   0x00000000004004d9 <+57>:    jne    0x4004d0 <main+48>
   0x00000000004004db <+59>:    callq  0x400480 <pause@plt>
[...]
The emitted debug information contains both information about the caller and the inlined instance of the function. This is insufficient to reconstruct a call stack with associated state. In this case, the debugger is only able to disambiguate the innermost invocation of the function call.
Debug Information Quality
Though some optimizations will certainly impact the accuracy of a symbolic debugger, some compilers simply lack the ability to generate debug information in the presence of certain optimizations. One common optimization is induction variable elimination. A variable that’s incremented or decremented by a constant on every iteration of a loop or derived from another variable that follows this pattern, is an induction variable.
Take the following snippet.
static unsigned int
count(char *buffer, size_t n)
{
        unsigned int sum = 0;
        size_t i;

        for (i = 0; i < n; i++)
                sum += buffer[i] == 'w';

        return sum;
}
This function will return the count of “w” characters in a string as seen below.
$ gcc -o wc wc.c -O2 -ggdb
$ ./wc /etc/passwd
16
In this particular case, the function is invoked using:
count(buffer, 4096);
Coupled with other optimizations, the compiler is then able to generate code
that doesn’t actually rely on a dedicated counter variable i for maintaining
the current offer into buffer. An approximate semantic mapping from the
source-code to the generated executable code is below.
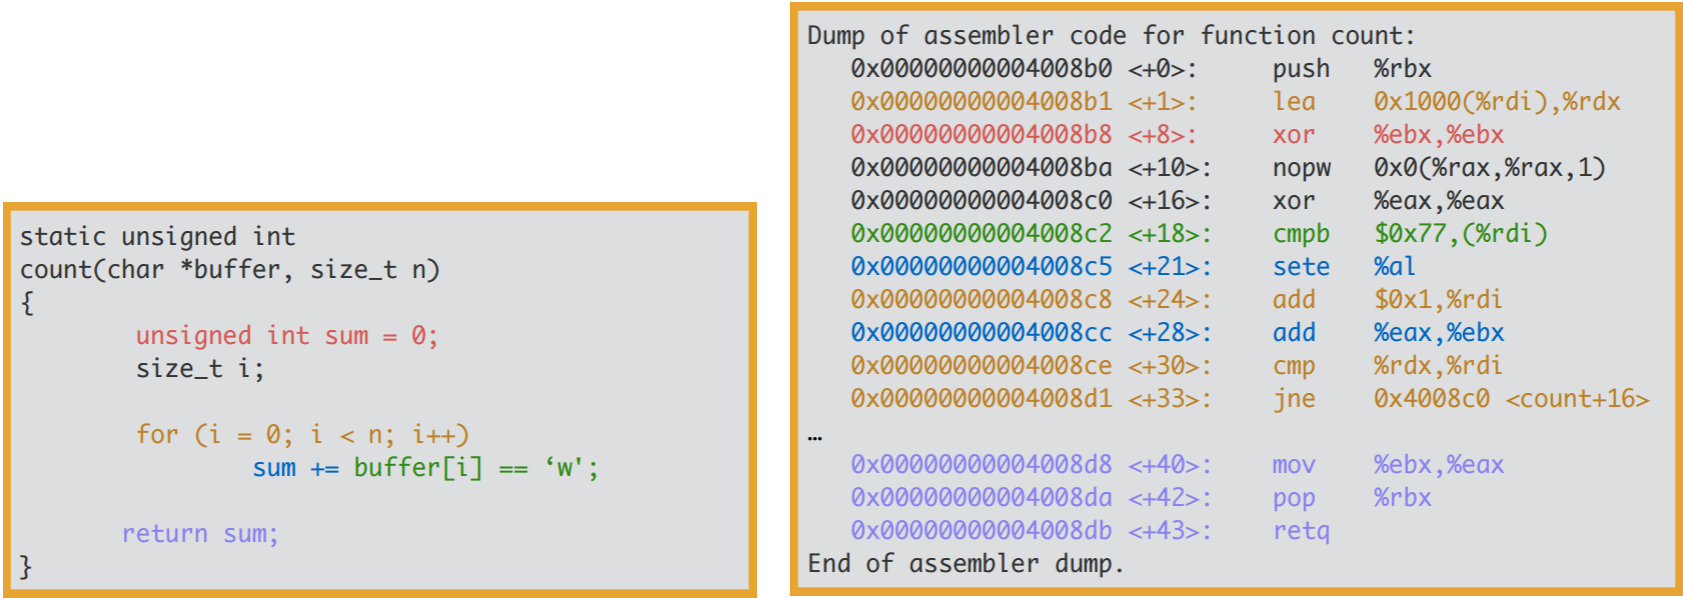
As you can see, i is completely optimized out. The compiler determines it
doesn’t have to pay the cost of maintaining the induction variable i. It
maintains the pointer in the register %rdi. The code is effectively rewritten
to something closer to this:
static unsigned int
count(char *buffer)
{
        unsigned int sum = 0;
        char *buffer_end = buffer + 4096;

        while (buffer != buffer_end)
                sum += *buffer++ == 'w';

        return sum;
}
Both gcc and clang will end up generating similar executable code for this
program. Debug information must support aggressive compiler optimizations and
for that reason is highly expressive. For example, let’s look at the debug
information generated by gcc (using the dwarfdump tool).
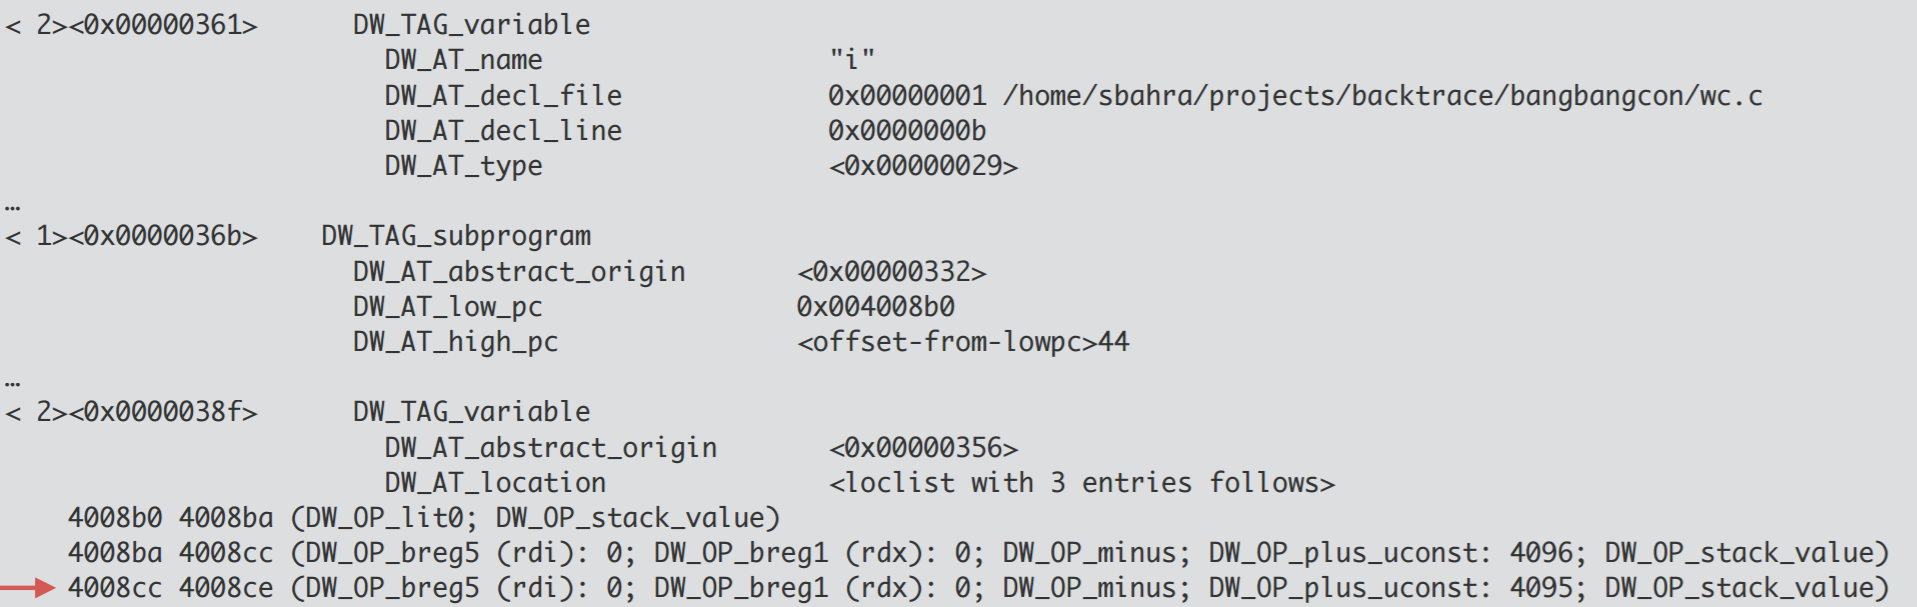
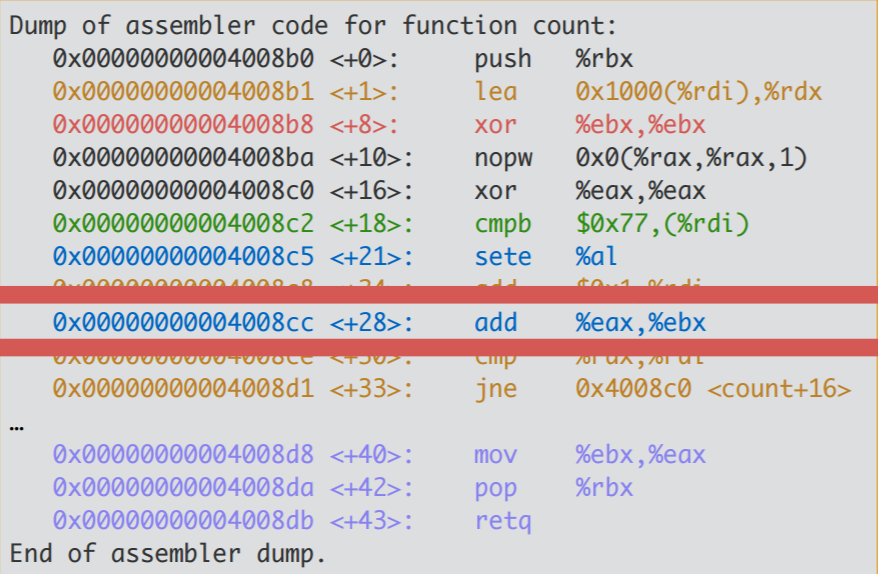
The highlighted line indicate how to interpret the current state of registers
to extract the value of variable i when the instruction pointer is pointing
between memory addresses 4008cc and 4008ce. The highlighted line below is the
instruction at address 4008cc.
The debug information (in the DWARF format) expresses the value of i using a
state machine. The highlighted debug information in the first screenshot
expresses that the debugger should push the value of the rdi register onto the
stack, then the value of the rdx register, subtract the two, and then add the
value 4095 to find the value of i. Note that the debug information does not
describe the value of i in all regions of executable code where it is live
(meaning, a debugger would be unable to retrieve the value). clang on the other
hand is unable to express this and for some variables, may simply provide
invalid information rather than indicate that the value is optimized out. See
below for an invocation of a debugger on versions of this program compiled
under gcc and clang.
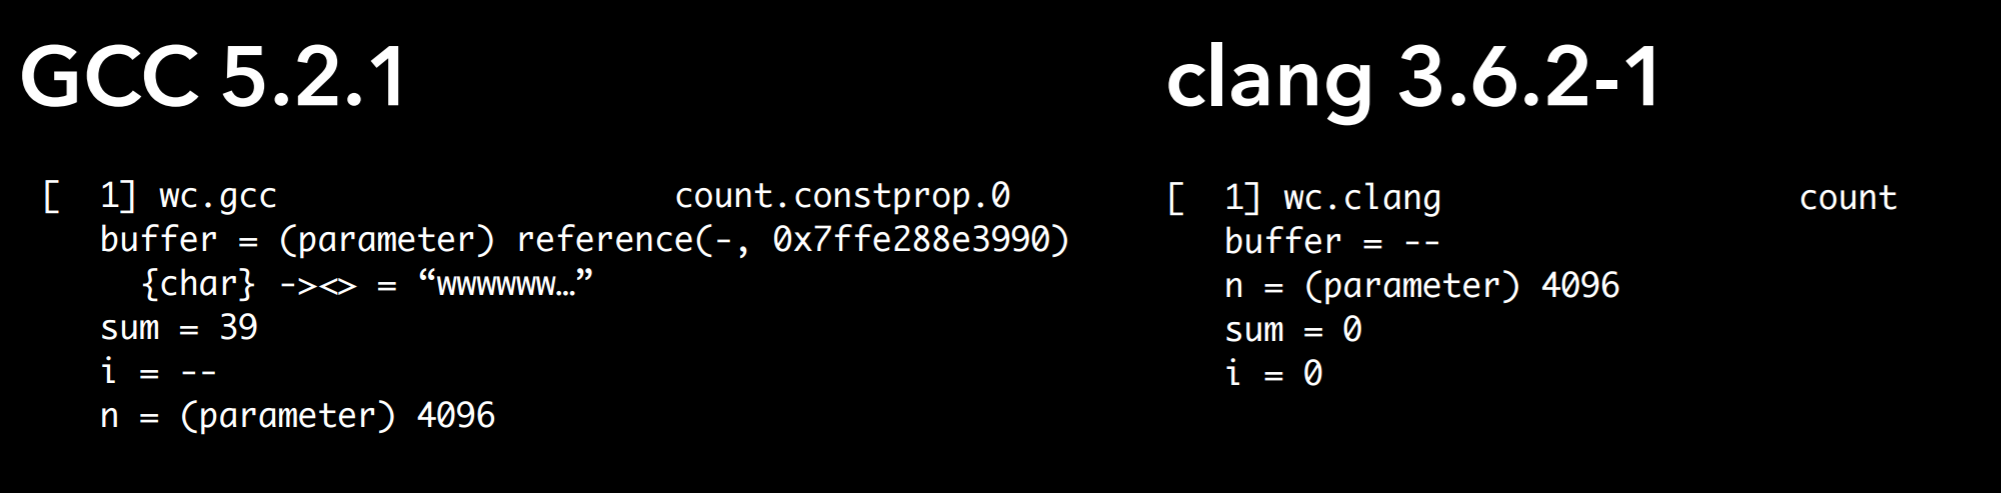
gcc is able to recover the value of the i variable depending on the instruction
being executed by the program at the time a debugger attempts to extract its
value. clang on the other hand has erroneous debug information and expresses
the values of both sum and i as a constant of 0.
Beyond optimizations, clang is unable to express certain data types with
optimizations turned on such as bit fields. A more exhaustive comparison
between the two compilers will be presented in an upcoming blog post.
Conclusion
We have shown some common optimizations that may get in the way of the debuggability of your application and demonstrated a disparity in debug information quality across two popular compilers. In the next blog post of this series, we will examine how gcc and clang stack up with regards to debug information quality across a myriad of synthetic applications and real world applications.
If you’re interested in better debugging capabilities for your applications including C++ crash reporting and native crash reporting, check us out at our website.
Follow me on Twitter at @0xf390.